Immigrants from Venezuela vs Tsimshian Unemployment Among Ages 45 to 54 years
COMPARE
Immigrants from Venezuela
Tsimshian
Unemployment Among Ages 45 to 54 years
Unemployment Among Ages 45 to 54 years Comparison
Immigrants from Venezuela
Tsimshian
3.9%
UNEMPLOYMENT AMONG AGES 45 TO 54 YEARS
100.0/ 100
METRIC RATING
7th/ 347
METRIC RANK
4.5%
UNEMPLOYMENT AMONG AGES 45 TO 54 YEARS
74.6/ 100
METRIC RATING
150th/ 347
METRIC RANK
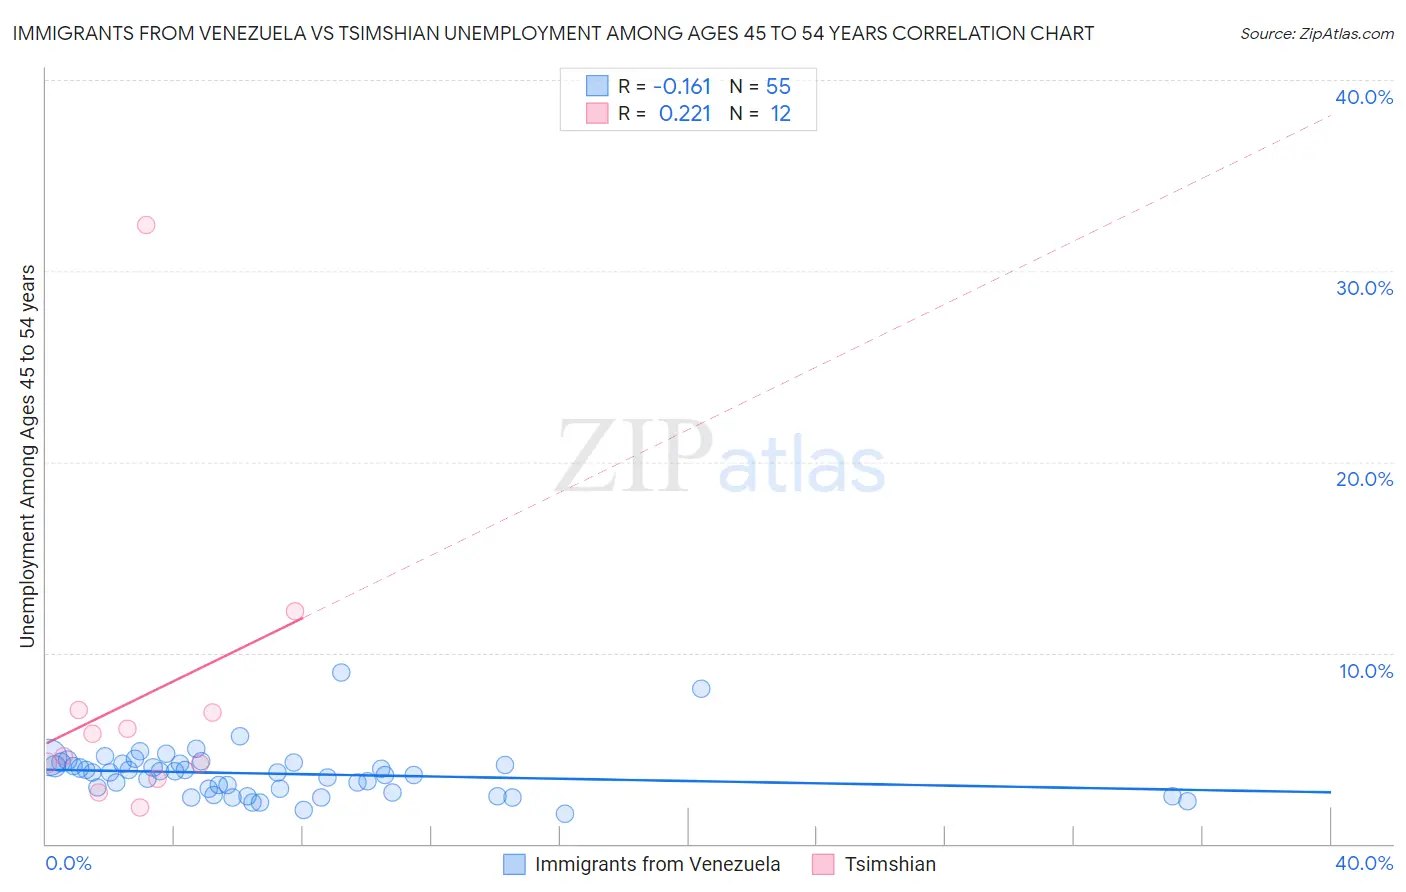
Immigrants from Venezuela vs Tsimshian Unemployment Among Ages 45 to 54 years Correlation Chart
The statistical analysis conducted on geographies consisting of 284,200,404 people shows a poor negative correlation between the proportion of Immigrants from Venezuela and unemployment rate among population between the ages 45 and 54 in the United States with a correlation coefficient (R) of -0.161 and weighted average of 3.9%. Similarly, the statistical analysis conducted on geographies consisting of 15,556,119 people shows a weak positive correlation between the proportion of Tsimshian and unemployment rate among population between the ages 45 and 54 in the United States with a correlation coefficient (R) of 0.221 and weighted average of 4.5%, a difference of 13.1%.
Unemployment Among Ages 45 to 54 years Correlation Summary
| Measurement | Immigrants from Venezuela | Tsimshian |
| Minimum | 1.6% | 1.9% |
| Maximum | 9.0% | 32.4% |
| Range | 7.4% | 30.5% |
| Mean | 3.7% | 7.6% |
| Median | 3.7% | 5.2% |
| Interquartile 25% (IQ1) | 2.7% | 3.8% |
| Interquartile 75% (IQ3) | 4.2% | 7.0% |
| Interquartile Range (IQR) | 1.5% | 3.2% |
| Standard Deviation (Sample) | 1.3% | 8.3% |
| Standard Deviation (Population) | 1.3% | 7.9% |
Similar Demographics by Unemployment Among Ages 45 to 54 years
Demographics Similar to Immigrants from Venezuela by Unemployment Among Ages 45 to 54 years
In terms of unemployment among ages 45 to 54 years, the demographic groups most similar to Immigrants from Venezuela are Chinese (4.0%, a difference of 0.36%), Czech (4.0%, a difference of 0.52%), Venezuelan (4.0%, a difference of 1.1%), Immigrants from Cuba (3.9%, a difference of 1.2%), and Scandinavian (4.0%, a difference of 1.3%).
| Demographics | Rating | Rank | Unemployment Among Ages 45 to 54 years |
| Hmong | 100.0 /100 | #1 | Exceptional 3.7% |
| Fijians | 100.0 /100 | #2 | Exceptional 3.8% |
| Norwegians | 100.0 /100 | #3 | Exceptional 3.9% |
| Immigrants | India | 100.0 /100 | #4 | Exceptional 3.9% |
| Danes | 100.0 /100 | #5 | Exceptional 3.9% |
| Immigrants | Cuba | 100.0 /100 | #6 | Exceptional 3.9% |
| Immigrants | Venezuela | 100.0 /100 | #7 | Exceptional 3.9% |
| Chinese | 100.0 /100 | #8 | Exceptional 4.0% |
| Czechs | 100.0 /100 | #9 | Exceptional 4.0% |
| Venezuelans | 100.0 /100 | #10 | Exceptional 4.0% |
| Scandinavians | 100.0 /100 | #11 | Exceptional 4.0% |
| Swedes | 100.0 /100 | #12 | Exceptional 4.0% |
| Cubans | 100.0 /100 | #13 | Exceptional 4.0% |
| Immigrants | Bosnia and Herzegovina | 100.0 /100 | #14 | Exceptional 4.0% |
| Immigrants | Bolivia | 100.0 /100 | #15 | Exceptional 4.0% |
Demographics Similar to Tsimshian by Unemployment Among Ages 45 to 54 years
In terms of unemployment among ages 45 to 54 years, the demographic groups most similar to Tsimshian are Cypriot (4.5%, a difference of 0.010%), Immigrants from Austria (4.5%, a difference of 0.040%), Costa Rican (4.5%, a difference of 0.040%), Korean (4.5%, a difference of 0.10%), and Hungarian (4.5%, a difference of 0.10%).
| Demographics | Rating | Rank | Unemployment Among Ages 45 to 54 years |
| Macedonians | 79.0 /100 | #143 | Good 4.5% |
| Taiwanese | 77.9 /100 | #144 | Good 4.5% |
| Immigrants | Latvia | 77.5 /100 | #145 | Good 4.5% |
| Syrians | 77.3 /100 | #146 | Good 4.5% |
| Uruguayans | 76.9 /100 | #147 | Good 4.5% |
| Immigrants | Austria | 75.3 /100 | #148 | Good 4.5% |
| Costa Ricans | 75.3 /100 | #149 | Good 4.5% |
| Tsimshian | 74.6 /100 | #150 | Good 4.5% |
| Cypriots | 74.4 /100 | #151 | Good 4.5% |
| Koreans | 73.1 /100 | #152 | Good 4.5% |
| Hungarians | 73.0 /100 | #153 | Good 4.5% |
| Immigrants | Spain | 72.5 /100 | #154 | Good 4.5% |
| Marshallese | 70.6 /100 | #155 | Good 4.5% |
| Immigrants | Croatia | 69.6 /100 | #156 | Good 4.5% |
| Indians (Asian) | 68.1 /100 | #157 | Good 4.5% |