Immigrants from Venezuela vs American Unemployment Among Women with Children Ages 6 to 17 years
COMPARE
Immigrants from Venezuela
American
Unemployment Among Women with Children Ages 6 to 17 years
Unemployment Among Women with Children Ages 6 to 17 years Comparison
Immigrants from Venezuela
Americans
10.2%
UNEMPLOYMENT AMONG WOMEN WITH CHILDREN AGES 6 TO 17 YEARS
0.0/ 100
METRIC RATING
304th/ 347
METRIC RANK
10.4%
UNEMPLOYMENT AMONG WOMEN WITH CHILDREN AGES 6 TO 17 YEARS
0.0/ 100
METRIC RATING
313th/ 347
METRIC RANK
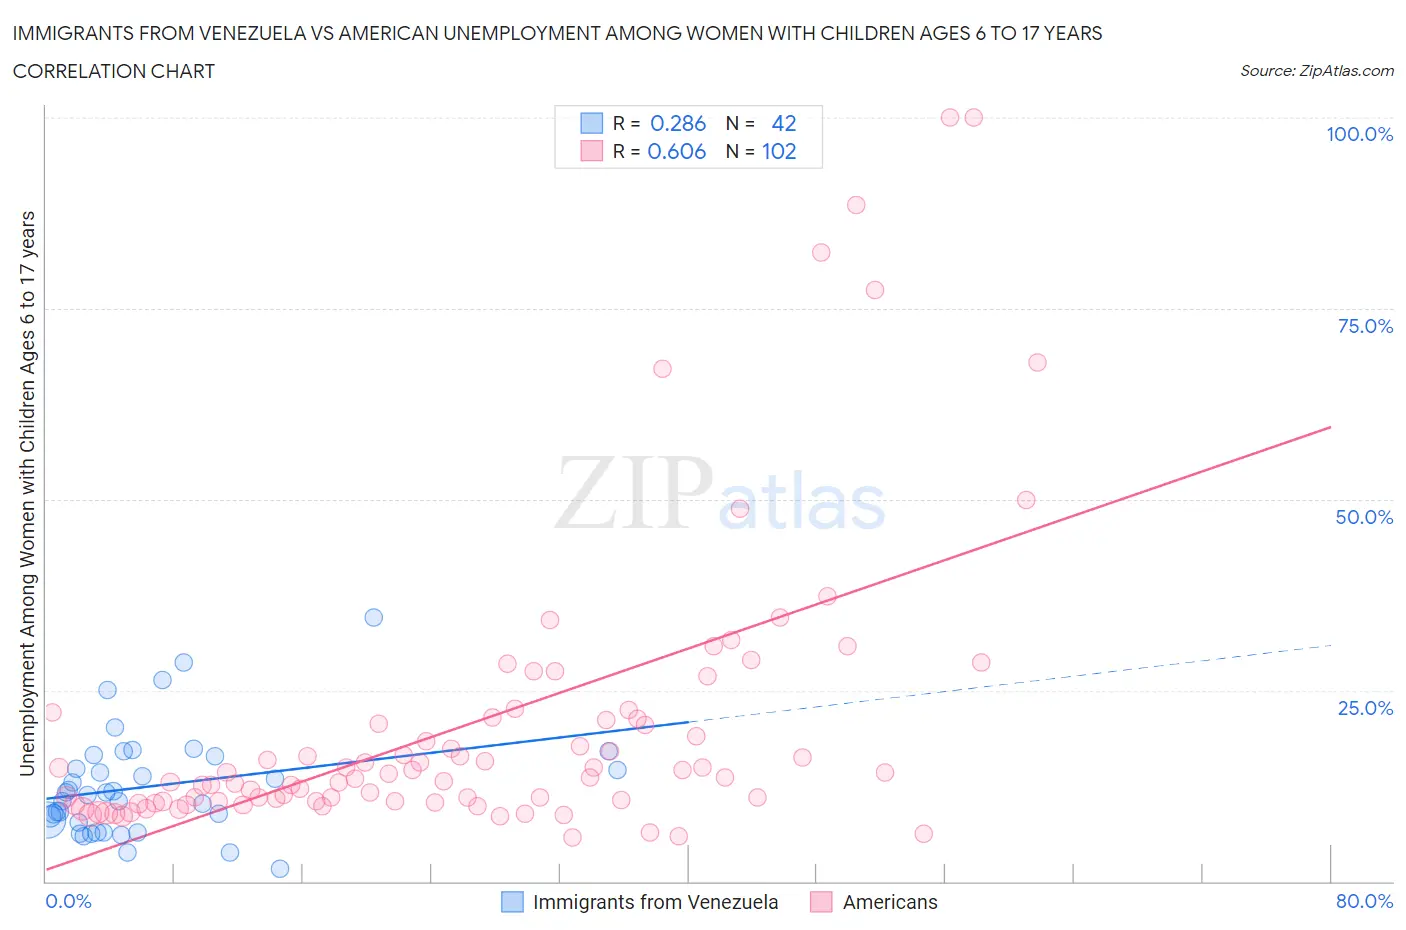
Immigrants from Venezuela vs American Unemployment Among Women with Children Ages 6 to 17 years Correlation Chart
The statistical analysis conducted on geographies consisting of 220,713,316 people shows a weak positive correlation between the proportion of Immigrants from Venezuela and unemployment rate among women with children between the ages 6 and 17 in the United States with a correlation coefficient (R) of 0.286 and weighted average of 10.2%. Similarly, the statistical analysis conducted on geographies consisting of 361,036,029 people shows a significant positive correlation between the proportion of Americans and unemployment rate among women with children between the ages 6 and 17 in the United States with a correlation coefficient (R) of 0.606 and weighted average of 10.4%, a difference of 2.2%.
Unemployment Among Women with Children Ages 6 to 17 years Correlation Summary
| Measurement | Immigrants from Venezuela | American |
| Minimum | 1.6% | 5.8% |
| Maximum | 34.5% | 100.0% |
| Range | 32.9% | 94.2% |
| Mean | 12.4% | 20.6% |
| Median | 11.4% | 13.9% |
| Interquartile 25% (IQ1) | 7.7% | 10.4% |
| Interquartile 75% (IQ3) | 16.3% | 21.3% |
| Interquartile Range (IQR) | 8.6% | 10.8% |
| Standard Deviation (Sample) | 6.9% | 19.3% |
| Standard Deviation (Population) | 6.8% | 19.2% |
Demographics Similar to Immigrants from Venezuela and Americans by Unemployment Among Women with Children Ages 6 to 17 years
In terms of unemployment among women with children ages 6 to 17 years, the demographic groups most similar to Immigrants from Venezuela are Immigrants from Nigeria (10.2%, a difference of 0.060%), Immigrants from Ecuador (10.2%, a difference of 0.090%), Venezuelan (10.2%, a difference of 0.27%), Paraguayan (10.2%, a difference of 0.35%), and Immigrants from Senegal (10.2%, a difference of 0.57%). Similarly, the demographic groups most similar to Americans are Immigrants from Cabo Verde (10.4%, a difference of 0.050%), Bahamian (10.4%, a difference of 0.080%), African (10.4%, a difference of 0.18%), Immigrants from Dominica (10.5%, a difference of 0.83%), and Bermudan (10.5%, a difference of 0.94%).
| Demographics | Rating | Rank | Unemployment Among Women with Children Ages 6 to 17 years |
| Immigrants | Haiti | 0.0 /100 | #298 | Tragic 10.1% |
| Immigrants | Honduras | 0.0 /100 | #299 | Tragic 10.1% |
| Nigerians | 0.0 /100 | #300 | Tragic 10.1% |
| Immigrants | Bahamas | 0.0 /100 | #301 | Tragic 10.1% |
| Venezuelans | 0.0 /100 | #302 | Tragic 10.2% |
| Immigrants | Ecuador | 0.0 /100 | #303 | Tragic 10.2% |
| Immigrants | Venezuela | 0.0 /100 | #304 | Tragic 10.2% |
| Immigrants | Nigeria | 0.0 /100 | #305 | Tragic 10.2% |
| Paraguayans | 0.0 /100 | #306 | Tragic 10.2% |
| Immigrants | Senegal | 0.0 /100 | #307 | Tragic 10.2% |
| Dutch West Indians | 0.0 /100 | #308 | Tragic 10.2% |
| French Canadians | 0.0 /100 | #309 | Tragic 10.3% |
| Alaska Natives | 0.0 /100 | #310 | Tragic 10.3% |
| Immigrants | Liberia | 0.0 /100 | #311 | Tragic 10.3% |
| Africans | 0.0 /100 | #312 | Tragic 10.4% |
| Americans | 0.0 /100 | #313 | Tragic 10.4% |
| Immigrants | Cabo Verde | 0.0 /100 | #314 | Tragic 10.4% |
| Bahamians | 0.0 /100 | #315 | Tragic 10.4% |
| Immigrants | Dominica | 0.0 /100 | #316 | Tragic 10.5% |
| Bermudans | 0.0 /100 | #317 | Tragic 10.5% |
| Delaware | 0.0 /100 | #318 | Tragic 10.5% |