Immigrants from Venezuela vs Yakama Unemployment Among Women with Children Ages 6 to 17 years
COMPARE
Immigrants from Venezuela
Yakama
Unemployment Among Women with Children Ages 6 to 17 years
Unemployment Among Women with Children Ages 6 to 17 years Comparison
Immigrants from Venezuela
Yakama
10.2%
UNEMPLOYMENT AMONG WOMEN WITH CHILDREN AGES 6 TO 17 YEARS
0.0/ 100
METRIC RATING
304th/ 347
METRIC RANK
9.9%
UNEMPLOYMENT AMONG WOMEN WITH CHILDREN AGES 6 TO 17 YEARS
0.0/ 100
METRIC RATING
284th/ 347
METRIC RANK
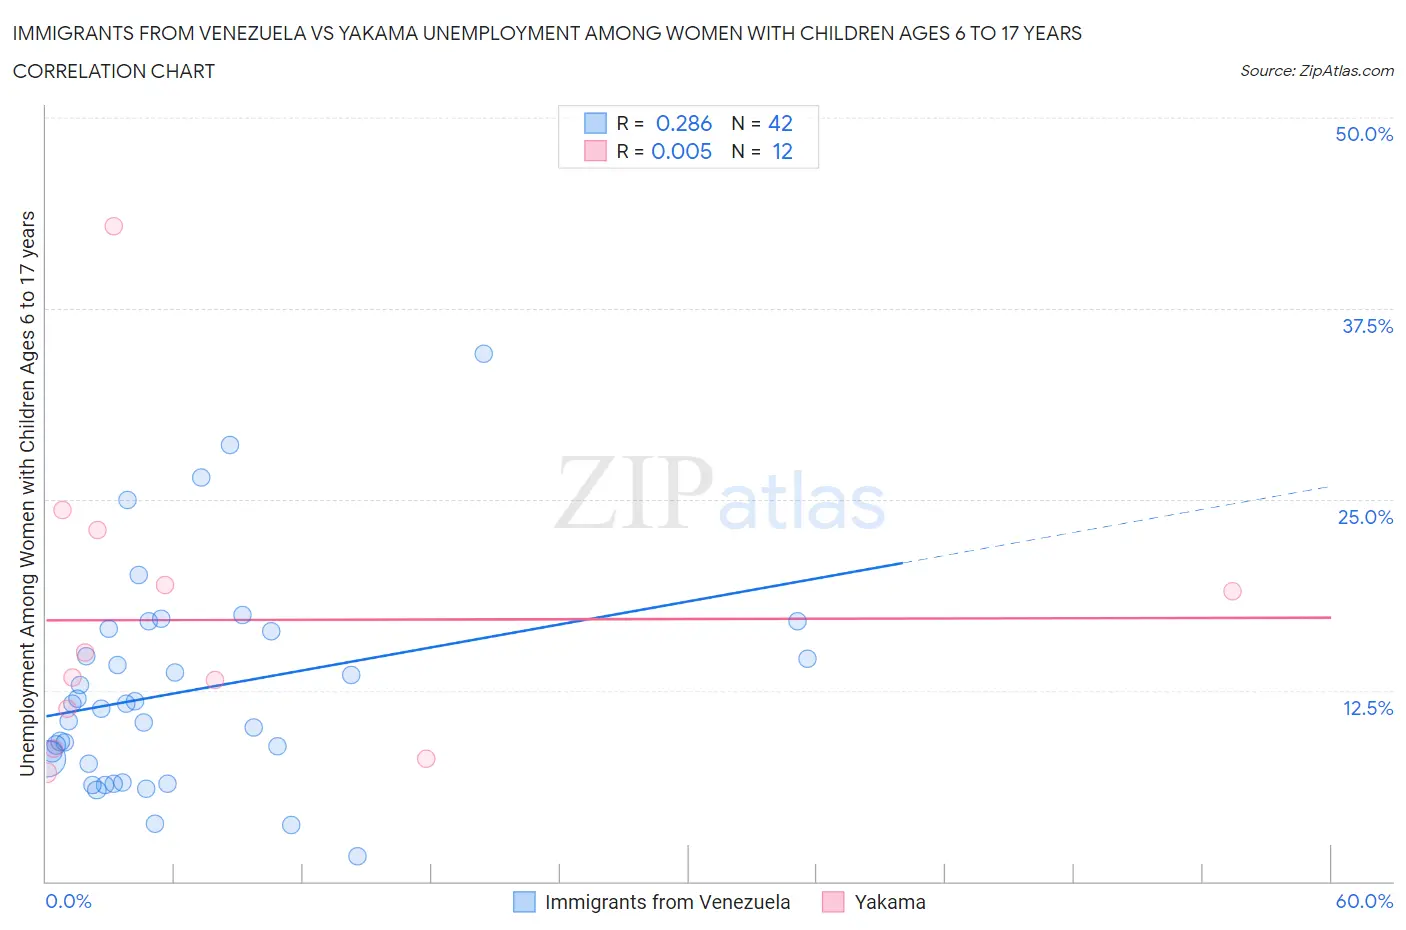
Immigrants from Venezuela vs Yakama Unemployment Among Women with Children Ages 6 to 17 years Correlation Chart
The statistical analysis conducted on geographies consisting of 220,713,316 people shows a weak positive correlation between the proportion of Immigrants from Venezuela and unemployment rate among women with children between the ages 6 and 17 in the United States with a correlation coefficient (R) of 0.286 and weighted average of 10.2%. Similarly, the statistical analysis conducted on geographies consisting of 17,342,387 people shows no correlation between the proportion of Yakama and unemployment rate among women with children between the ages 6 and 17 in the United States with a correlation coefficient (R) of 0.005 and weighted average of 9.9%, a difference of 3.0%.
Unemployment Among Women with Children Ages 6 to 17 years Correlation Summary
| Measurement | Immigrants from Venezuela | Yakama |
| Minimum | 1.6% | 7.1% |
| Maximum | 34.5% | 42.9% |
| Range | 32.9% | 35.8% |
| Mean | 12.4% | 17.1% |
| Median | 11.4% | 14.2% |
| Interquartile 25% (IQ1) | 7.7% | 10.0% |
| Interquartile 75% (IQ3) | 16.3% | 21.2% |
| Interquartile Range (IQR) | 8.6% | 11.2% |
| Standard Deviation (Sample) | 6.9% | 9.9% |
| Standard Deviation (Population) | 6.8% | 9.5% |
Demographics Similar to Immigrants from Venezuela and Yakama by Unemployment Among Women with Children Ages 6 to 17 years
In terms of unemployment among women with children ages 6 to 17 years, the demographic groups most similar to Immigrants from Venezuela are Immigrants from Ecuador (10.2%, a difference of 0.090%), Venezuelan (10.2%, a difference of 0.27%), Immigrants from Bahamas (10.1%, a difference of 0.72%), Nigerian (10.1%, a difference of 0.87%), and Immigrants from Honduras (10.1%, a difference of 0.89%). Similarly, the demographic groups most similar to Yakama are Hispanic or Latino (9.9%, a difference of 0.31%), Choctaw (9.9%, a difference of 0.43%), Sierra Leonean (9.9%, a difference of 0.47%), Shoshone (10.0%, a difference of 0.72%), and Honduran (10.0%, a difference of 1.1%).
| Demographics | Rating | Rank | Unemployment Among Women with Children Ages 6 to 17 years |
| Yakama | 0.0 /100 | #284 | Tragic 9.9% |
| Hispanics or Latinos | 0.0 /100 | #285 | Tragic 9.9% |
| Choctaw | 0.0 /100 | #286 | Tragic 9.9% |
| Sierra Leoneans | 0.0 /100 | #287 | Tragic 9.9% |
| Shoshone | 0.0 /100 | #288 | Tragic 10.0% |
| Hondurans | 0.0 /100 | #289 | Tragic 10.0% |
| Sub-Saharan Africans | 0.0 /100 | #290 | Tragic 10.0% |
| Immigrants | Nonimmigrants | 0.0 /100 | #291 | Tragic 10.0% |
| Carpatho Rusyns | 0.0 /100 | #292 | Tragic 10.0% |
| Haitians | 0.0 /100 | #293 | Tragic 10.0% |
| Ecuadorians | 0.0 /100 | #294 | Tragic 10.0% |
| Cherokee | 0.0 /100 | #295 | Tragic 10.0% |
| Immigrants | Western Africa | 0.0 /100 | #296 | Tragic 10.1% |
| Immigrants | Caribbean | 0.0 /100 | #297 | Tragic 10.1% |
| Immigrants | Haiti | 0.0 /100 | #298 | Tragic 10.1% |
| Immigrants | Honduras | 0.0 /100 | #299 | Tragic 10.1% |
| Nigerians | 0.0 /100 | #300 | Tragic 10.1% |
| Immigrants | Bahamas | 0.0 /100 | #301 | Tragic 10.1% |
| Venezuelans | 0.0 /100 | #302 | Tragic 10.2% |
| Immigrants | Ecuador | 0.0 /100 | #303 | Tragic 10.2% |
| Immigrants | Venezuela | 0.0 /100 | #304 | Tragic 10.2% |