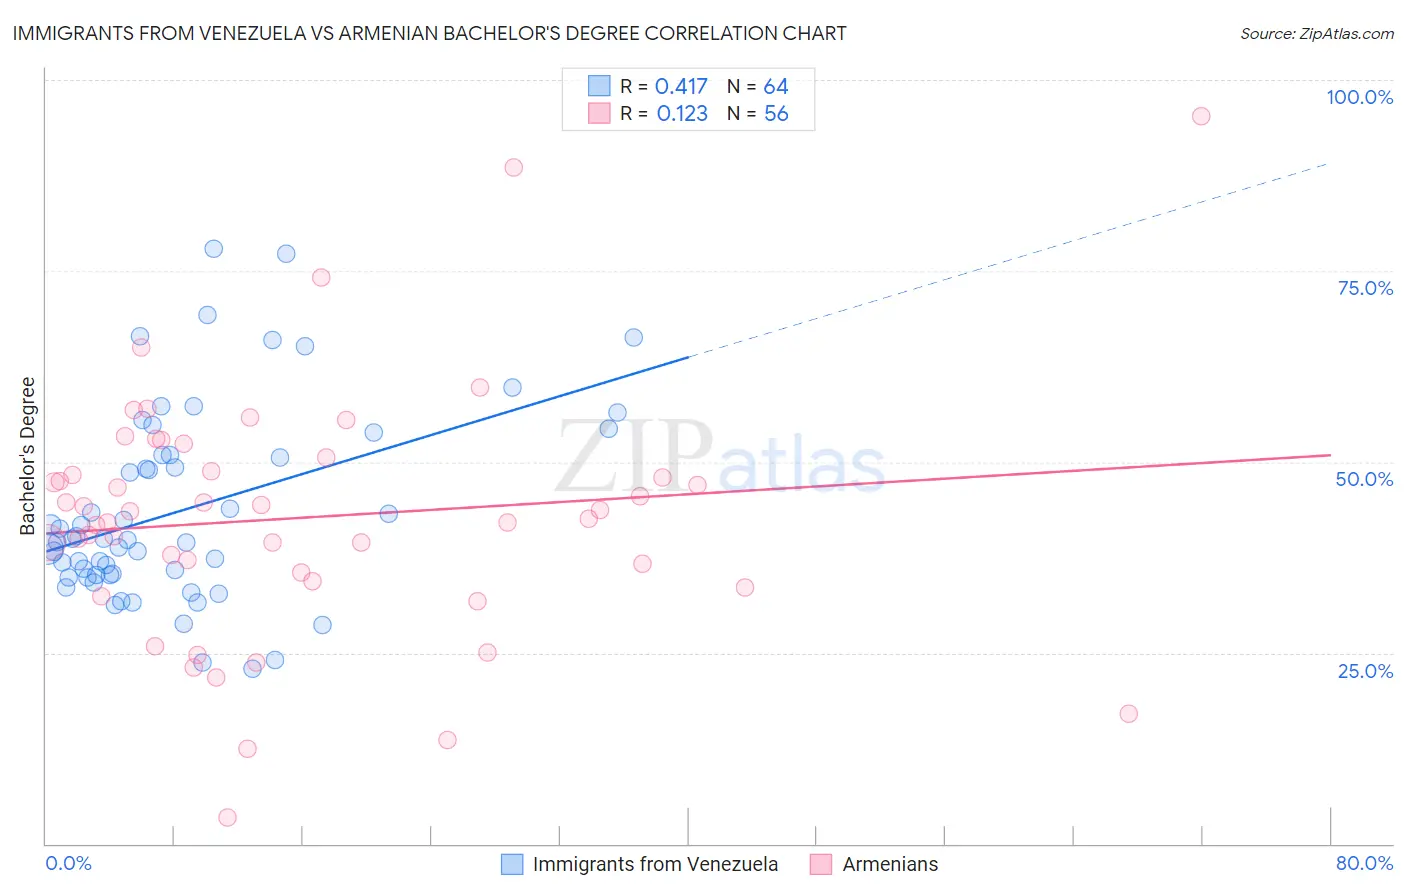
Immigrants from Venezuela vs Armenian Bachelor's Degree
COMPARE
Immigrants from Venezuela
Armenian
Bachelor's Degree
Bachelor's Degree Comparison
Immigrants from Venezuela
Armenians
40.2%
BACHELOR'S DEGREE
92.9/ 100
METRIC RATING
128th/ 347
METRIC RANK
42.3%
BACHELOR'S DEGREE
99.2/ 100
METRIC RATING
83rd/ 347
METRIC RANK
Immigrants from Venezuela vs Armenian Bachelor's Degree Correlation Chart
The statistical analysis conducted on geographies consisting of 287,853,697 people shows a moderate positive correlation between the proportion of Immigrants from Venezuela and percentage of population with at least bachelor's degree education in the United States with a correlation coefficient (R) of 0.417 and weighted average of 40.2%. Similarly, the statistical analysis conducted on geographies consisting of 310,935,621 people shows a poor positive correlation between the proportion of Armenians and percentage of population with at least bachelor's degree education in the United States with a correlation coefficient (R) of 0.123 and weighted average of 42.3%, a difference of 5.2%.
Bachelor's Degree Correlation Summary
| Measurement | Immigrants from Venezuela | Armenian |
| Minimum | 22.9% | 3.4% |
| Maximum | 77.9% | 95.3% |
| Range | 55.1% | 91.9% |
| Mean | 43.7% | 42.7% |
| Median | 39.8% | 43.0% |
| Interquartile 25% (IQ1) | 35.2% | 35.0% |
| Interquartile 75% (IQ3) | 50.9% | 49.7% |
| Interquartile Range (IQR) | 15.7% | 14.8% |
| Standard Deviation (Sample) | 12.7% | 16.3% |
| Standard Deviation (Population) | 12.6% | 16.2% |
Similar Demographics by Bachelor's Degree
Demographics Similar to Immigrants from Venezuela by Bachelor's Degree
In terms of bachelor's degree, the demographic groups most similar to Immigrants from Venezuela are Immigrants from Jordan (40.3%, a difference of 0.17%), Serbian (40.1%, a difference of 0.17%), Sierra Leonean (40.1%, a difference of 0.24%), Italian (40.1%, a difference of 0.32%), and Immigrants from Eastern Africa (40.4%, a difference of 0.46%).
| Demographics | Rating | Rank | Bachelor's Degree |
| Moroccans | 94.6 /100 | #121 | Exceptional 40.5% |
| Immigrants | Albania | 94.4 /100 | #122 | Exceptional 40.4% |
| Lebanese | 94.3 /100 | #123 | Exceptional 40.4% |
| Immigrants | Eritrea | 94.3 /100 | #124 | Exceptional 40.4% |
| British | 94.2 /100 | #125 | Exceptional 40.4% |
| Immigrants | Eastern Africa | 94.1 /100 | #126 | Exceptional 40.4% |
| Immigrants | Jordan | 93.4 /100 | #127 | Exceptional 40.3% |
| Immigrants | Venezuela | 92.9 /100 | #128 | Exceptional 40.2% |
| Serbians | 92.4 /100 | #129 | Exceptional 40.1% |
| Sierra Leoneans | 92.2 /100 | #130 | Exceptional 40.1% |
| Italians | 91.9 /100 | #131 | Exceptional 40.1% |
| Taiwanese | 91.1 /100 | #132 | Exceptional 40.0% |
| Immigrants | Southern Europe | 91.1 /100 | #133 | Exceptional 40.0% |
| Assyrians/Chaldeans/Syriacs | 89.4 /100 | #134 | Excellent 39.8% |
| Luxembourgers | 89.1 /100 | #135 | Excellent 39.8% |
Demographics Similar to Armenians by Bachelor's Degree
In terms of bachelor's degree, the demographic groups most similar to Armenians are Immigrants from Western Asia (42.3%, a difference of 0.020%), Immigrants from Scotland (42.3%, a difference of 0.030%), Lithuanian (42.2%, a difference of 0.040%), Immigrants from Hungary (42.3%, a difference of 0.10%), and Immigrants from Croatia (42.3%, a difference of 0.11%).
| Demographics | Rating | Rank | Bachelor's Degree |
| Immigrants | Egypt | 99.4 /100 | #76 | Exceptional 42.6% |
| Immigrants | Eastern Europe | 99.4 /100 | #77 | Exceptional 42.5% |
| Immigrants | Ethiopia | 99.4 /100 | #78 | Exceptional 42.5% |
| Immigrants | Lebanon | 99.3 /100 | #79 | Exceptional 42.4% |
| Immigrants | Croatia | 99.2 /100 | #80 | Exceptional 42.3% |
| Immigrants | Hungary | 99.2 /100 | #81 | Exceptional 42.3% |
| Immigrants | Scotland | 99.2 /100 | #82 | Exceptional 42.3% |
| Armenians | 99.2 /100 | #83 | Exceptional 42.3% |
| Immigrants | Western Asia | 99.2 /100 | #84 | Exceptional 42.3% |
| Lithuanians | 99.2 /100 | #85 | Exceptional 42.2% |
| Immigrants | Brazil | 99.2 /100 | #86 | Exceptional 42.2% |
| Carpatho Rusyns | 99.0 /100 | #87 | Exceptional 42.1% |
| Immigrants | Western Europe | 99.0 /100 | #88 | Exceptional 42.0% |
| Greeks | 99.0 /100 | #89 | Exceptional 42.0% |
| Laotians | 98.9 /100 | #90 | Exceptional 42.0% |