Immigrants from Uruguay vs Fijian Unemployment
COMPARE
Immigrants from Uruguay
Fijian
Unemployment
Unemployment Comparison
Immigrants from Uruguay
Fijians
5.3%
UNEMPLOYMENT
29.8/ 100
METRIC RATING
197th/ 347
METRIC RANK
5.0%
UNEMPLOYMENT
97.6/ 100
METRIC RATING
82nd/ 347
METRIC RANK
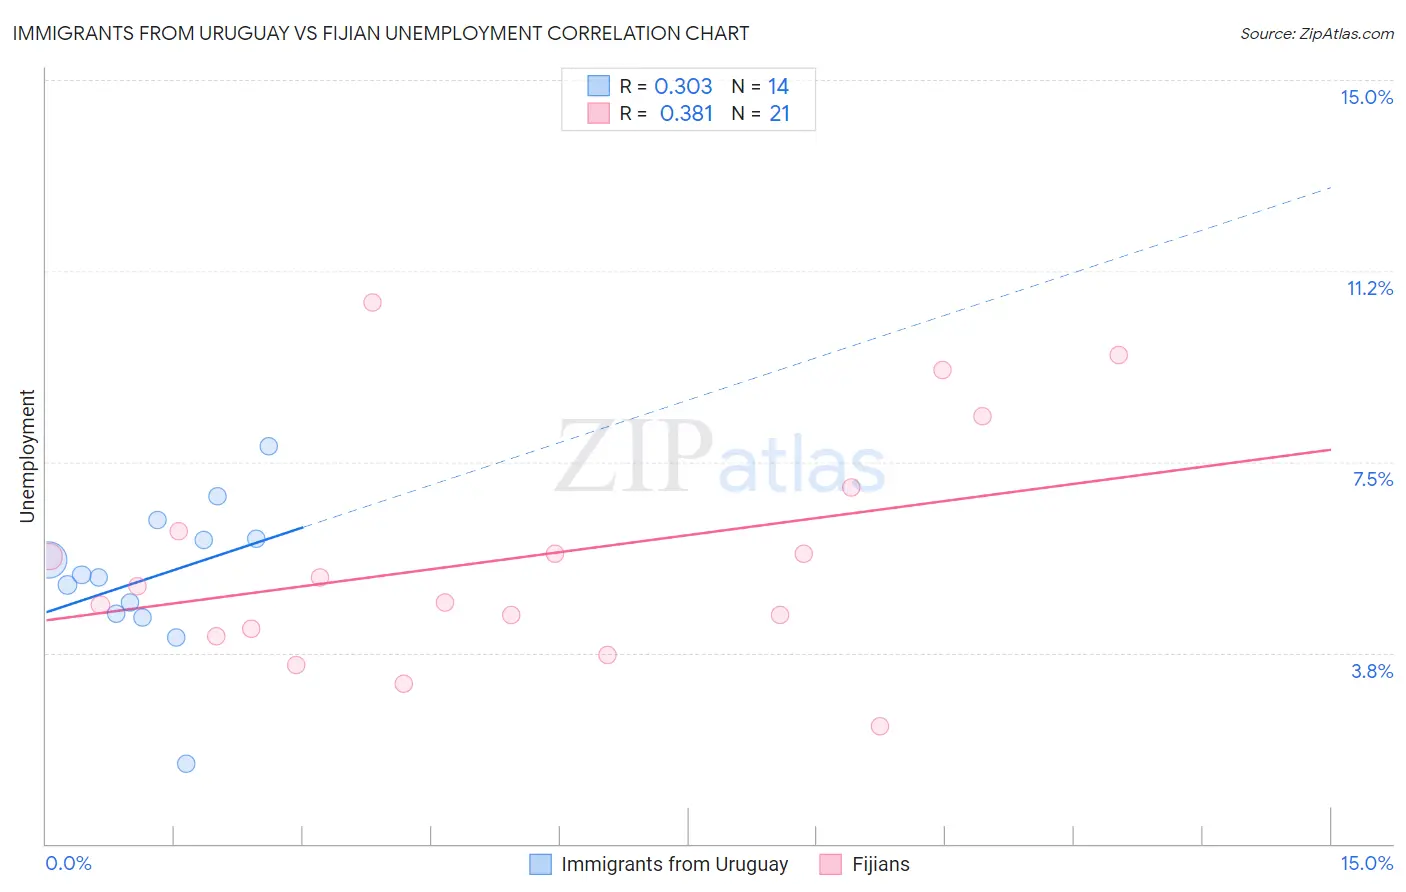
Immigrants from Uruguay vs Fijian Unemployment Correlation Chart
The statistical analysis conducted on geographies consisting of 133,243,021 people shows a mild positive correlation between the proportion of Immigrants from Uruguay and unemployment in the United States with a correlation coefficient (R) of 0.303 and weighted average of 5.3%. Similarly, the statistical analysis conducted on geographies consisting of 55,931,908 people shows a mild positive correlation between the proportion of Fijians and unemployment in the United States with a correlation coefficient (R) of 0.381 and weighted average of 5.0%, a difference of 7.4%.
Unemployment Correlation Summary
| Measurement | Immigrants from Uruguay | Fijian |
| Minimum | 1.6% | 2.3% |
| Maximum | 7.8% | 10.6% |
| Range | 6.2% | 8.3% |
| Mean | 5.2% | 5.6% |
| Median | 5.3% | 5.1% |
| Interquartile 25% (IQ1) | 4.5% | 4.1% |
| Interquartile 75% (IQ3) | 6.0% | 6.6% |
| Interquartile Range (IQR) | 1.5% | 2.4% |
| Standard Deviation (Sample) | 1.5% | 2.2% |
| Standard Deviation (Population) | 1.4% | 2.2% |
Similar Demographics by Unemployment
Demographics Similar to Immigrants from Uruguay by Unemployment
In terms of unemployment, the demographic groups most similar to Immigrants from Uruguay are Peruvian (5.3%, a difference of 0.010%), Immigrants from Laos (5.3%, a difference of 0.080%), Immigrants from Southern Europe (5.3%, a difference of 0.080%), Immigrants from Israel (5.3%, a difference of 0.090%), and Immigrants from Afghanistan (5.3%, a difference of 0.090%).
| Demographics | Rating | Rank | Unemployment |
| Arabs | 35.3 /100 | #190 | Fair 5.3% |
| Somalis | 34.0 /100 | #191 | Fair 5.3% |
| South Americans | 33.9 /100 | #192 | Fair 5.3% |
| Immigrants | Somalia | 33.8 /100 | #193 | Fair 5.3% |
| Immigrants | Laos | 30.9 /100 | #194 | Fair 5.3% |
| Immigrants | Southern Europe | 30.9 /100 | #195 | Fair 5.3% |
| Peruvians | 29.9 /100 | #196 | Fair 5.3% |
| Immigrants | Uruguay | 29.8 /100 | #197 | Fair 5.3% |
| Immigrants | Israel | 28.6 /100 | #198 | Fair 5.3% |
| Immigrants | Afghanistan | 28.6 /100 | #199 | Fair 5.3% |
| Koreans | 27.4 /100 | #200 | Fair 5.3% |
| Immigrants | South Eastern Asia | 27.0 /100 | #201 | Fair 5.3% |
| Cherokee | 25.5 /100 | #202 | Fair 5.3% |
| Immigrants | Micronesia | 25.2 /100 | #203 | Fair 5.3% |
| Immigrants | Ukraine | 24.9 /100 | #204 | Fair 5.3% |
Demographics Similar to Fijians by Unemployment
In terms of unemployment, the demographic groups most similar to Fijians are Basque (5.0%, a difference of 0.010%), Hmong (5.0%, a difference of 0.010%), Immigrants from Sweden (5.0%, a difference of 0.020%), Canadian (5.0%, a difference of 0.090%), and Russian (5.0%, a difference of 0.090%).
| Demographics | Rating | Rank | Unemployment |
| Turks | 98.0 /100 | #75 | Exceptional 4.9% |
| German Russians | 98.0 /100 | #76 | Exceptional 4.9% |
| Cypriots | 97.9 /100 | #77 | Exceptional 4.9% |
| Okinawans | 97.9 /100 | #78 | Exceptional 4.9% |
| Canadians | 97.7 /100 | #79 | Exceptional 5.0% |
| Immigrants | Sweden | 97.6 /100 | #80 | Exceptional 5.0% |
| Basques | 97.6 /100 | #81 | Exceptional 5.0% |
| Fijians | 97.6 /100 | #82 | Exceptional 5.0% |
| Hmong | 97.6 /100 | #83 | Exceptional 5.0% |
| Russians | 97.4 /100 | #84 | Exceptional 5.0% |
| Immigrants | Australia | 97.0 /100 | #85 | Exceptional 5.0% |
| Hungarians | 96.9 /100 | #86 | Exceptional 5.0% |
| Immigrants | Moldova | 96.6 /100 | #87 | Exceptional 5.0% |
| Immigrants | Korea | 96.6 /100 | #88 | Exceptional 5.0% |
| Jordanians | 96.4 /100 | #89 | Exceptional 5.0% |