Immigrants from Uruguay vs U.S. Virgin Islander Unemployment
COMPARE
Immigrants from Uruguay
U.S. Virgin Islander
Unemployment
Unemployment Comparison
Immigrants from Uruguay
U.S. Virgin Islanders
5.3%
UNEMPLOYMENT
29.8/ 100
METRIC RATING
197th/ 347
METRIC RANK
6.3%
UNEMPLOYMENT
0.0/ 100
METRIC RATING
295th/ 347
METRIC RANK
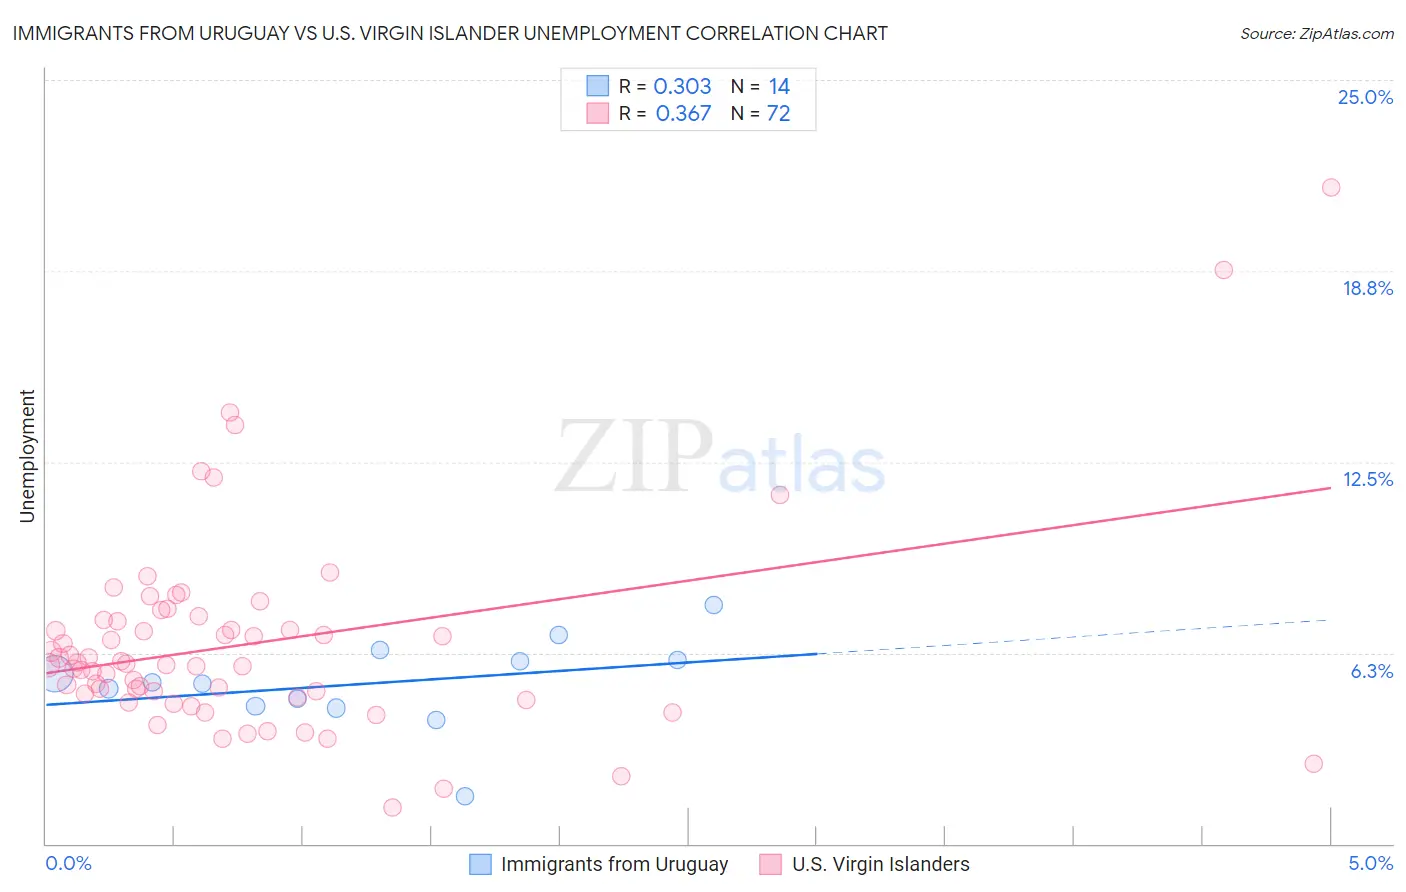
Immigrants from Uruguay vs U.S. Virgin Islander Unemployment Correlation Chart
The statistical analysis conducted on geographies consisting of 133,243,021 people shows a mild positive correlation between the proportion of Immigrants from Uruguay and unemployment in the United States with a correlation coefficient (R) of 0.303 and weighted average of 5.3%. Similarly, the statistical analysis conducted on geographies consisting of 87,515,102 people shows a mild positive correlation between the proportion of U.S. Virgin Islanders and unemployment in the United States with a correlation coefficient (R) of 0.367 and weighted average of 6.3%, a difference of 17.3%.
Unemployment Correlation Summary
| Measurement | Immigrants from Uruguay | U.S. Virgin Islander |
| Minimum | 1.6% | 1.2% |
| Maximum | 7.8% | 21.5% |
| Range | 6.2% | 20.3% |
| Mean | 5.2% | 6.6% |
| Median | 5.3% | 5.9% |
| Interquartile 25% (IQ1) | 4.5% | 4.9% |
| Interquartile 75% (IQ3) | 6.0% | 7.3% |
| Interquartile Range (IQR) | 1.5% | 2.4% |
| Standard Deviation (Sample) | 1.5% | 3.3% |
| Standard Deviation (Population) | 1.4% | 3.3% |
Similar Demographics by Unemployment
Demographics Similar to Immigrants from Uruguay by Unemployment
In terms of unemployment, the demographic groups most similar to Immigrants from Uruguay are Peruvian (5.3%, a difference of 0.010%), Immigrants from Laos (5.3%, a difference of 0.080%), Immigrants from Southern Europe (5.3%, a difference of 0.080%), Immigrants from Israel (5.3%, a difference of 0.090%), and Immigrants from Afghanistan (5.3%, a difference of 0.090%).
| Demographics | Rating | Rank | Unemployment |
| Arabs | 35.3 /100 | #190 | Fair 5.3% |
| Somalis | 34.0 /100 | #191 | Fair 5.3% |
| South Americans | 33.9 /100 | #192 | Fair 5.3% |
| Immigrants | Somalia | 33.8 /100 | #193 | Fair 5.3% |
| Immigrants | Laos | 30.9 /100 | #194 | Fair 5.3% |
| Immigrants | Southern Europe | 30.9 /100 | #195 | Fair 5.3% |
| Peruvians | 29.9 /100 | #196 | Fair 5.3% |
| Immigrants | Uruguay | 29.8 /100 | #197 | Fair 5.3% |
| Immigrants | Israel | 28.6 /100 | #198 | Fair 5.3% |
| Immigrants | Afghanistan | 28.6 /100 | #199 | Fair 5.3% |
| Koreans | 27.4 /100 | #200 | Fair 5.3% |
| Immigrants | South Eastern Asia | 27.0 /100 | #201 | Fair 5.3% |
| Cherokee | 25.5 /100 | #202 | Fair 5.3% |
| Immigrants | Micronesia | 25.2 /100 | #203 | Fair 5.3% |
| Immigrants | Ukraine | 24.9 /100 | #204 | Fair 5.3% |
Demographics Similar to U.S. Virgin Islanders by Unemployment
In terms of unemployment, the demographic groups most similar to U.S. Virgin Islanders are Immigrants from Ecuador (6.2%, a difference of 0.12%), Spanish American Indian (6.2%, a difference of 0.12%), Central American Indian (6.2%, a difference of 0.22%), Haitian (6.2%, a difference of 0.23%), and Ute (6.3%, a difference of 0.45%).
| Demographics | Rating | Rank | Unemployment |
| Ecuadorians | 0.0 /100 | #288 | Tragic 6.2% |
| Chippewa | 0.0 /100 | #289 | Tragic 6.2% |
| Senegalese | 0.0 /100 | #290 | Tragic 6.2% |
| Haitians | 0.0 /100 | #291 | Tragic 6.2% |
| Central American Indians | 0.0 /100 | #292 | Tragic 6.2% |
| Immigrants | Ecuador | 0.0 /100 | #293 | Tragic 6.2% |
| Spanish American Indians | 0.0 /100 | #294 | Tragic 6.2% |
| U.S. Virgin Islanders | 0.0 /100 | #295 | Tragic 6.3% |
| Ute | 0.0 /100 | #296 | Tragic 6.3% |
| Jamaicans | 0.0 /100 | #297 | Tragic 6.3% |
| Immigrants | Haiti | 0.0 /100 | #298 | Tragic 6.3% |
| Immigrants | West Indies | 0.0 /100 | #299 | Tragic 6.3% |
| Immigrants | Trinidad and Tobago | 0.0 /100 | #300 | Tragic 6.3% |
| Trinidadians and Tobagonians | 0.0 /100 | #301 | Tragic 6.3% |
| West Indians | 0.0 /100 | #302 | Tragic 6.4% |