Immigrants from Nepal vs Pima Unemployment
COMPARE
Immigrants from Nepal
Pima
Unemployment
Unemployment Comparison
Immigrants from Nepal
Pima
4.8%
UNEMPLOYMENT
99.4/ 100
METRIC RATING
46th/ 347
METRIC RANK
8.2%
UNEMPLOYMENT
0.0/ 100
METRIC RATING
338th/ 347
METRIC RANK
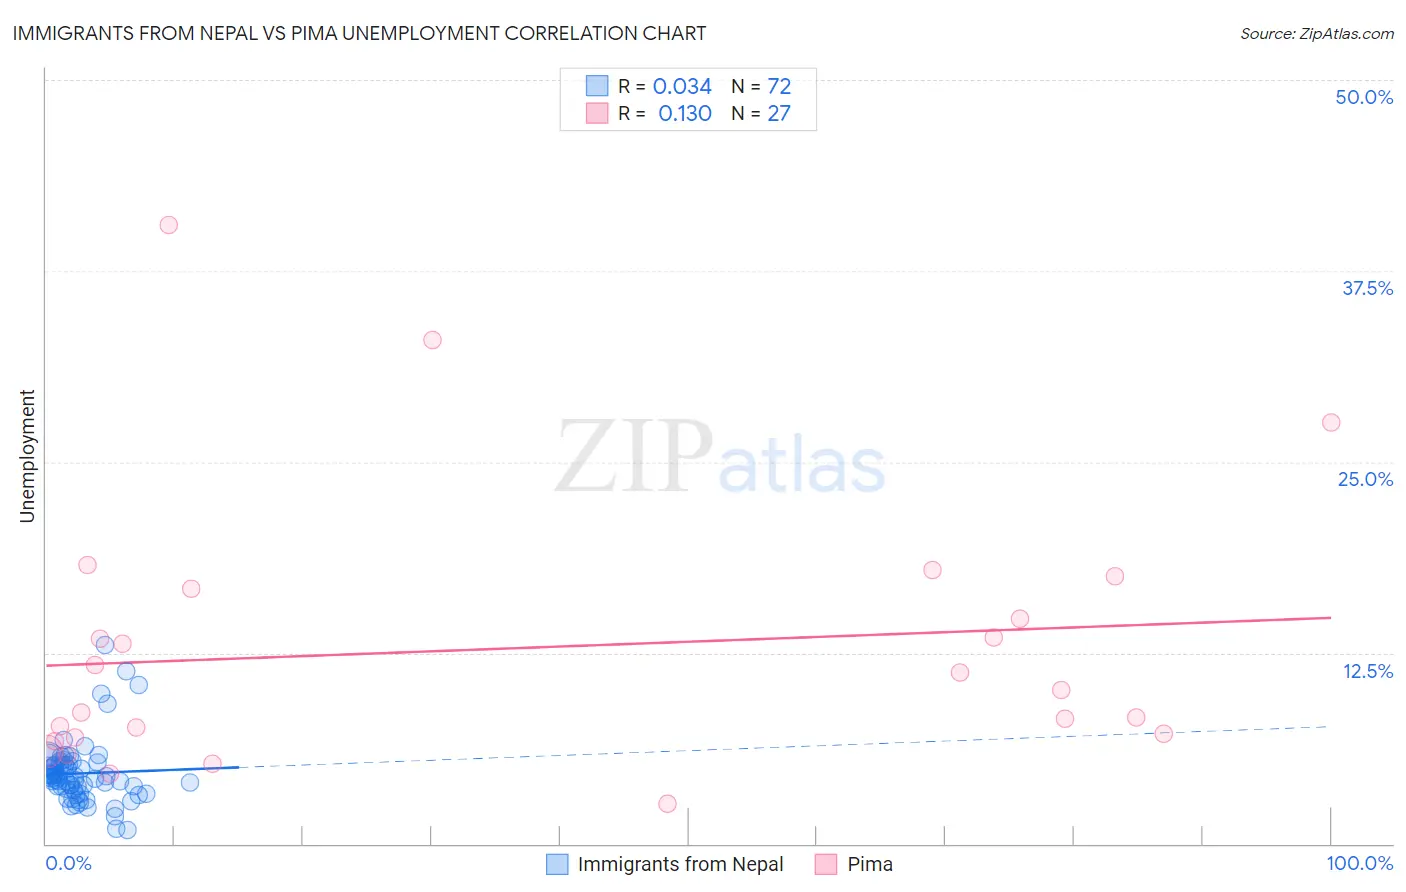
Immigrants from Nepal vs Pima Unemployment Correlation Chart
The statistical analysis conducted on geographies consisting of 186,724,623 people shows no correlation between the proportion of Immigrants from Nepal and unemployment in the United States with a correlation coefficient (R) of 0.034 and weighted average of 4.8%. Similarly, the statistical analysis conducted on geographies consisting of 61,529,497 people shows a poor positive correlation between the proportion of Pima and unemployment in the United States with a correlation coefficient (R) of 0.130 and weighted average of 8.2%, a difference of 69.7%.
Unemployment Correlation Summary
| Measurement | Immigrants from Nepal | Pima |
| Minimum | 0.90% | 2.6% |
| Maximum | 13.0% | 40.5% |
| Range | 12.1% | 37.9% |
| Mean | 4.6% | 12.8% |
| Median | 4.3% | 10.1% |
| Interquartile 25% (IQ1) | 3.5% | 6.9% |
| Interquartile 75% (IQ3) | 5.2% | 16.7% |
| Interquartile Range (IQR) | 1.6% | 9.8% |
| Standard Deviation (Sample) | 2.1% | 8.9% |
| Standard Deviation (Population) | 2.1% | 8.7% |
Similar Demographics by Unemployment
Demographics Similar to Immigrants from Nepal by Unemployment
In terms of unemployment, the demographic groups most similar to Immigrants from Nepal are Immigrants from Taiwan (4.8%, a difference of 0.020%), French (4.8%, a difference of 0.16%), Austrian (4.8%, a difference of 0.22%), Immigrants from Scotland (4.9%, a difference of 0.23%), and Immigrants from South Central Asia (4.9%, a difference of 0.24%).
| Demographics | Rating | Rank | Unemployment |
| Lithuanians | 99.7 /100 | #39 | Exceptional 4.8% |
| Northern Europeans | 99.7 /100 | #40 | Exceptional 4.8% |
| Immigrants | Bosnia and Herzegovina | 99.7 /100 | #41 | Exceptional 4.8% |
| Filipinos | 99.5 /100 | #42 | Exceptional 4.8% |
| Yugoslavians | 99.5 /100 | #43 | Exceptional 4.8% |
| Austrians | 99.5 /100 | #44 | Exceptional 4.8% |
| French | 99.5 /100 | #45 | Exceptional 4.8% |
| Immigrants | Nepal | 99.4 /100 | #46 | Exceptional 4.8% |
| Immigrants | Taiwan | 99.4 /100 | #47 | Exceptional 4.8% |
| Immigrants | Scotland | 99.3 /100 | #48 | Exceptional 4.9% |
| Immigrants | South Central Asia | 99.3 /100 | #49 | Exceptional 4.9% |
| French Canadians | 99.3 /100 | #50 | Exceptional 4.9% |
| Immigrants | Belgium | 99.2 /100 | #51 | Exceptional 4.9% |
| Whites/Caucasians | 99.2 /100 | #52 | Exceptional 4.9% |
| Immigrants | Zimbabwe | 99.2 /100 | #53 | Exceptional 4.9% |
Demographics Similar to Pima by Unemployment
In terms of unemployment, the demographic groups most similar to Pima are Navajo (8.4%, a difference of 1.6%), Puerto Rican (8.4%, a difference of 2.4%), Cheyenne (8.0%, a difference of 2.8%), Immigrants from Yemen (7.7%, a difference of 6.7%), and Alaskan Athabascan (7.7%, a difference of 7.5%).
| Demographics | Rating | Rank | Unemployment |
| Dominicans | 0.0 /100 | #331 | Tragic 7.4% |
| Sioux | 0.0 /100 | #332 | Tragic 7.4% |
| Immigrants | Dominican Republic | 0.0 /100 | #333 | Tragic 7.4% |
| Apache | 0.0 /100 | #334 | Tragic 7.4% |
| Alaskan Athabascans | 0.0 /100 | #335 | Tragic 7.7% |
| Immigrants | Yemen | 0.0 /100 | #336 | Tragic 7.7% |
| Cheyenne | 0.0 /100 | #337 | Tragic 8.0% |
| Pima | 0.0 /100 | #338 | Tragic 8.2% |
| Navajo | 0.0 /100 | #339 | Tragic 8.4% |
| Puerto Ricans | 0.0 /100 | #340 | Tragic 8.4% |
| Tohono O'odham | 0.0 /100 | #341 | Tragic 8.9% |
| Hopi | 0.0 /100 | #342 | Tragic 8.9% |
| Yuman | 0.0 /100 | #343 | Tragic 9.1% |
| Arapaho | 0.0 /100 | #344 | Tragic 9.8% |
| Inupiat | 0.0 /100 | #345 | Tragic 10.1% |