Immigrants from Sri Lanka vs French Canadian Unemployment
COMPARE
Immigrants from Sri Lanka
French Canadian
Unemployment
Unemployment Comparison
Immigrants from Sri Lanka
French Canadians
5.1%
UNEMPLOYMENT
91.1/ 100
METRIC RATING
116th/ 347
METRIC RANK
4.9%
UNEMPLOYMENT
99.3/ 100
METRIC RATING
50th/ 347
METRIC RANK
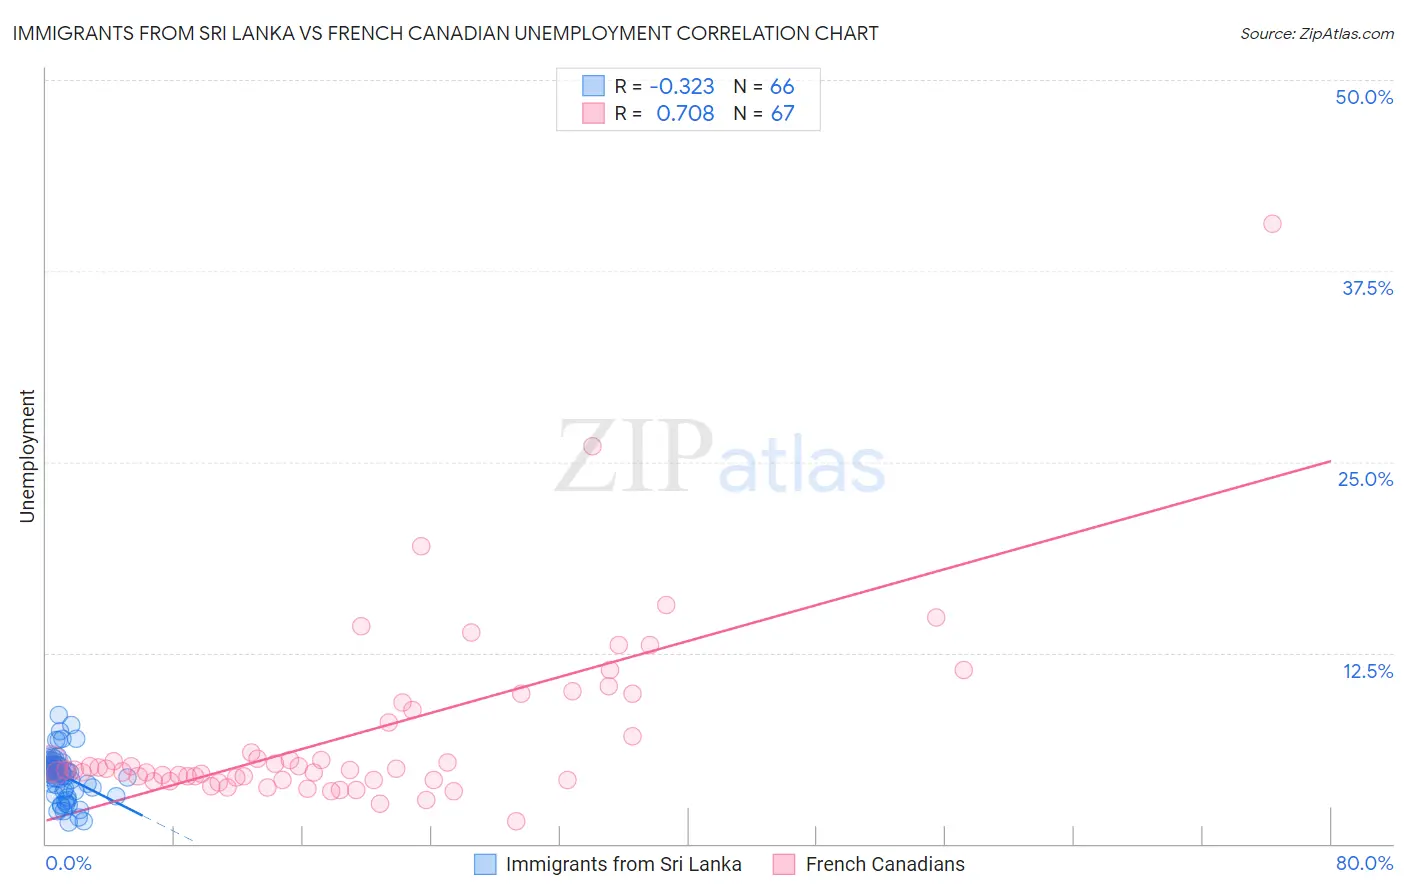
Immigrants from Sri Lanka vs French Canadian Unemployment Correlation Chart
The statistical analysis conducted on geographies consisting of 149,679,955 people shows a mild negative correlation between the proportion of Immigrants from Sri Lanka and unemployment in the United States with a correlation coefficient (R) of -0.323 and weighted average of 5.1%. Similarly, the statistical analysis conducted on geographies consisting of 500,867,403 people shows a strong positive correlation between the proportion of French Canadians and unemployment in the United States with a correlation coefficient (R) of 0.708 and weighted average of 4.9%, a difference of 4.4%.
Unemployment Correlation Summary
| Measurement | Immigrants from Sri Lanka | French Canadian |
| Minimum | 1.4% | 1.5% |
| Maximum | 8.4% | 40.6% |
| Range | 7.0% | 39.1% |
| Mean | 4.5% | 7.1% |
| Median | 4.7% | 4.9% |
| Interquartile 25% (IQ1) | 3.5% | 4.2% |
| Interquartile 75% (IQ3) | 5.2% | 8.7% |
| Interquartile Range (IQR) | 1.8% | 4.5% |
| Standard Deviation (Sample) | 1.5% | 6.0% |
| Standard Deviation (Population) | 1.5% | 6.0% |
Similar Demographics by Unemployment
Demographics Similar to Immigrants from Sri Lanka by Unemployment
In terms of unemployment, the demographic groups most similar to Immigrants from Sri Lanka are Immigrants from Western Europe (5.1%, a difference of 0.010%), Immigrants from Malaysia (5.1%, a difference of 0.020%), Immigrants from Germany (5.1%, a difference of 0.050%), Immigrants from Ireland (5.1%, a difference of 0.22%), and Immigrants from France (5.1%, a difference of 0.26%).
| Demographics | Rating | Rank | Unemployment |
| Immigrants | Eritrea | 93.3 /100 | #109 | Exceptional 5.0% |
| Immigrants | Lithuania | 93.2 /100 | #110 | Exceptional 5.0% |
| Chileans | 93.2 /100 | #111 | Exceptional 5.0% |
| South Africans | 92.6 /100 | #112 | Exceptional 5.1% |
| Argentineans | 92.4 /100 | #113 | Exceptional 5.1% |
| Immigrants | Ireland | 92.1 /100 | #114 | Exceptional 5.1% |
| Immigrants | Western Europe | 91.1 /100 | #115 | Exceptional 5.1% |
| Immigrants | Sri Lanka | 91.1 /100 | #116 | Exceptional 5.1% |
| Immigrants | Malaysia | 91.0 /100 | #117 | Exceptional 5.1% |
| Immigrants | Germany | 90.8 /100 | #118 | Exceptional 5.1% |
| Immigrants | France | 89.7 /100 | #119 | Excellent 5.1% |
| Macedonians | 89.7 /100 | #120 | Excellent 5.1% |
| Lebanese | 89.2 /100 | #121 | Excellent 5.1% |
| Immigrants | Switzerland | 89.1 /100 | #122 | Excellent 5.1% |
| Asians | 89.0 /100 | #123 | Excellent 5.1% |
Demographics Similar to French Canadians by Unemployment
In terms of unemployment, the demographic groups most similar to French Canadians are Immigrants from South Central Asia (4.9%, a difference of 0.020%), Immigrants from Scotland (4.9%, a difference of 0.030%), Immigrants from Belgium (4.9%, a difference of 0.16%), White/Caucasian (4.9%, a difference of 0.17%), and Immigrants from Zimbabwe (4.9%, a difference of 0.20%).
| Demographics | Rating | Rank | Unemployment |
| Yugoslavians | 99.5 /100 | #43 | Exceptional 4.8% |
| Austrians | 99.5 /100 | #44 | Exceptional 4.8% |
| French | 99.5 /100 | #45 | Exceptional 4.8% |
| Immigrants | Nepal | 99.4 /100 | #46 | Exceptional 4.8% |
| Immigrants | Taiwan | 99.4 /100 | #47 | Exceptional 4.8% |
| Immigrants | Scotland | 99.3 /100 | #48 | Exceptional 4.9% |
| Immigrants | South Central Asia | 99.3 /100 | #49 | Exceptional 4.9% |
| French Canadians | 99.3 /100 | #50 | Exceptional 4.9% |
| Immigrants | Belgium | 99.2 /100 | #51 | Exceptional 4.9% |
| Whites/Caucasians | 99.2 /100 | #52 | Exceptional 4.9% |
| Immigrants | Zimbabwe | 99.2 /100 | #53 | Exceptional 4.9% |
| Eastern Europeans | 99.2 /100 | #54 | Exceptional 4.9% |
| Australians | 99.2 /100 | #55 | Exceptional 4.9% |
| Celtics | 99.1 /100 | #56 | Exceptional 4.9% |
| Immigrants | Singapore | 99.1 /100 | #57 | Exceptional 4.9% |