Immigrants from Thailand vs Welsh Unemployment Among Women with Children Ages 6 to 17 years
COMPARE
Immigrants from Thailand
Welsh
Unemployment Among Women with Children Ages 6 to 17 years
Unemployment Among Women with Children Ages 6 to 17 years Comparison
Immigrants from Thailand
Welsh
8.3%
UNEMPLOYMENT AMONG WOMEN WITH CHILDREN AGES 6 TO 17 YEARS
99.9/ 100
METRIC RATING
69th/ 347
METRIC RANK
9.3%
UNEMPLOYMENT AMONG WOMEN WITH CHILDREN AGES 6 TO 17 YEARS
4.0/ 100
METRIC RATING
230th/ 347
METRIC RANK
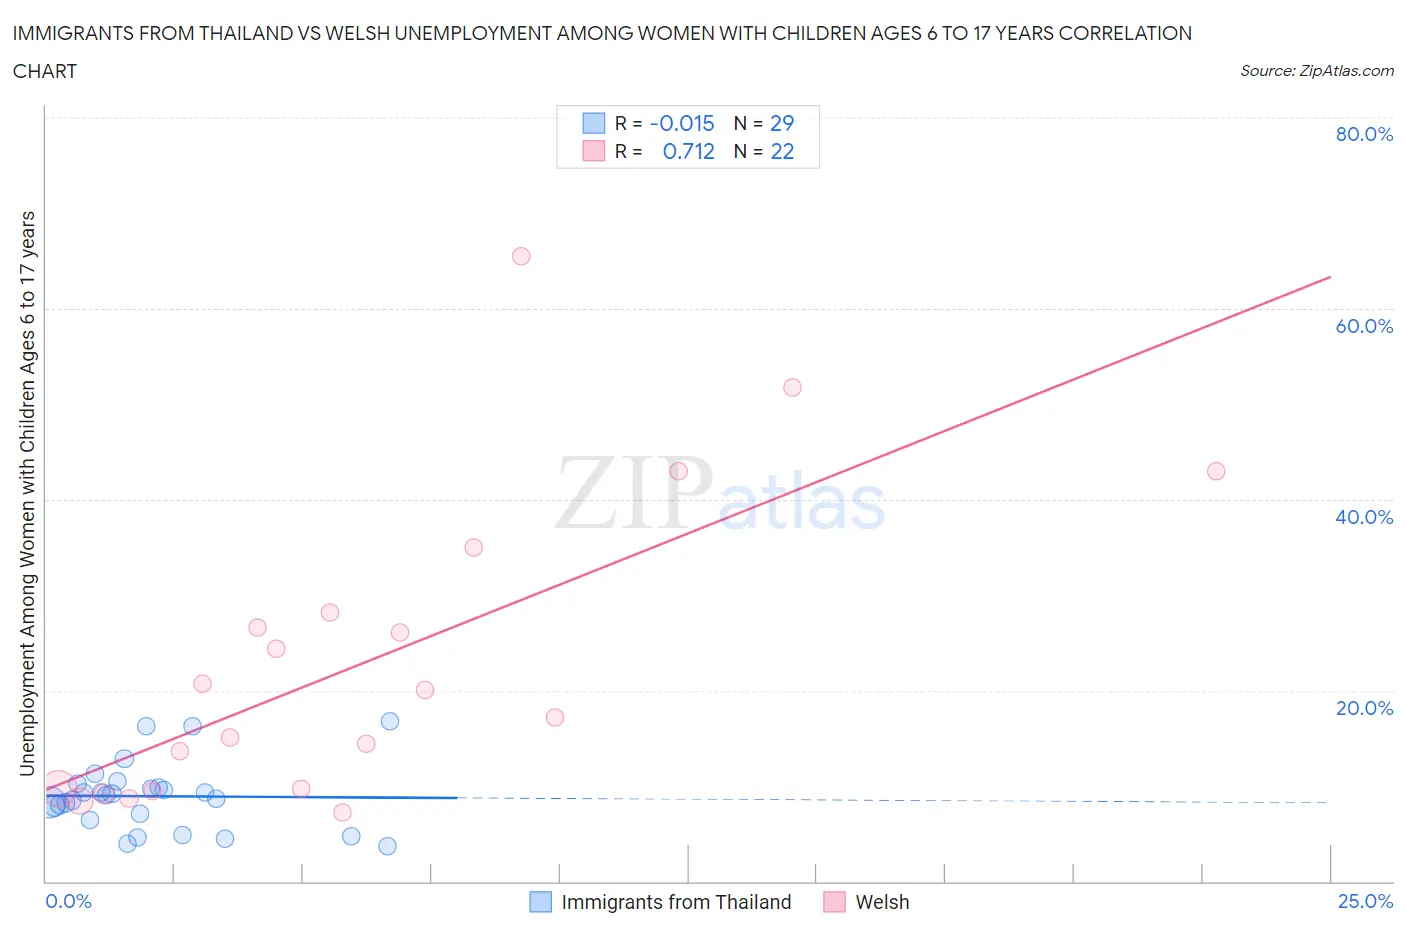
Immigrants from Thailand vs Welsh Unemployment Among Women with Children Ages 6 to 17 years Correlation Chart
The statistical analysis conducted on geographies consisting of 241,273,781 people shows no correlation between the proportion of Immigrants from Thailand and unemployment rate among women with children between the ages 6 and 17 in the United States with a correlation coefficient (R) of -0.015 and weighted average of 8.3%. Similarly, the statistical analysis conducted on geographies consisting of 338,386,980 people shows a strong positive correlation between the proportion of Welsh and unemployment rate among women with children between the ages 6 and 17 in the United States with a correlation coefficient (R) of 0.712 and weighted average of 9.3%, a difference of 11.7%.
Unemployment Among Women with Children Ages 6 to 17 years Correlation Summary
| Measurement | Immigrants from Thailand | Welsh |
| Minimum | 3.7% | 7.2% |
| Maximum | 16.7% | 65.4% |
| Range | 13.0% | 58.2% |
| Mean | 8.9% | 23.0% |
| Median | 9.0% | 18.6% |
| Interquartile 25% (IQ1) | 6.7% | 9.7% |
| Interquartile 75% (IQ3) | 10.0% | 28.2% |
| Interquartile Range (IQR) | 3.2% | 18.5% |
| Standard Deviation (Sample) | 3.5% | 15.9% |
| Standard Deviation (Population) | 3.4% | 15.5% |
Similar Demographics by Unemployment Among Women with Children Ages 6 to 17 years
Demographics Similar to Immigrants from Thailand by Unemployment Among Women with Children Ages 6 to 17 years
In terms of unemployment among women with children ages 6 to 17 years, the demographic groups most similar to Immigrants from Thailand are Marshallese (8.3%, a difference of 0.030%), Norwegian (8.3%, a difference of 0.080%), Armenian (8.3%, a difference of 0.11%), Immigrants from Australia (8.3%, a difference of 0.15%), and Immigrants from Nepal (8.3%, a difference of 0.18%).
| Demographics | Rating | Rank | Unemployment Among Women with Children Ages 6 to 17 years |
| Spanish American Indians | 100.0 /100 | #62 | Exceptional 8.2% |
| Immigrants | South Eastern Asia | 99.9 /100 | #63 | Exceptional 8.2% |
| Immigrants | Kuwait | 99.9 /100 | #64 | Exceptional 8.3% |
| Immigrants | Albania | 99.9 /100 | #65 | Exceptional 8.3% |
| Luxembourgers | 99.9 /100 | #66 | Exceptional 8.3% |
| Armenians | 99.9 /100 | #67 | Exceptional 8.3% |
| Marshallese | 99.9 /100 | #68 | Exceptional 8.3% |
| Immigrants | Thailand | 99.9 /100 | #69 | Exceptional 8.3% |
| Norwegians | 99.9 /100 | #70 | Exceptional 8.3% |
| Immigrants | Australia | 99.8 /100 | #71 | Exceptional 8.3% |
| Immigrants | Nepal | 99.8 /100 | #72 | Exceptional 8.3% |
| Spanish Americans | 99.8 /100 | #73 | Exceptional 8.4% |
| Samoans | 99.7 /100 | #74 | Exceptional 8.4% |
| Immigrants | Sri Lanka | 99.7 /100 | #75 | Exceptional 8.4% |
| Immigrants | Moldova | 99.7 /100 | #76 | Exceptional 8.4% |
Demographics Similar to Welsh by Unemployment Among Women with Children Ages 6 to 17 years
In terms of unemployment among women with children ages 6 to 17 years, the demographic groups most similar to Welsh are Macedonian (9.3%, a difference of 0.010%), French American Indian (9.3%, a difference of 0.070%), Lumbee (9.3%, a difference of 0.090%), Estonian (9.3%, a difference of 0.13%), and Panamanian (9.3%, a difference of 0.15%).
| Demographics | Rating | Rank | Unemployment Among Women with Children Ages 6 to 17 years |
| Immigrants | Eritrea | 5.8 /100 | #223 | Tragic 9.2% |
| Immigrants | El Salvador | 5.3 /100 | #224 | Tragic 9.3% |
| Chinese | 5.2 /100 | #225 | Tragic 9.3% |
| Immigrants | Azores | 4.6 /100 | #226 | Tragic 9.3% |
| Panamanians | 4.5 /100 | #227 | Tragic 9.3% |
| Estonians | 4.4 /100 | #228 | Tragic 9.3% |
| Lumbee | 4.3 /100 | #229 | Tragic 9.3% |
| Welsh | 4.0 /100 | #230 | Tragic 9.3% |
| Macedonians | 3.9 /100 | #231 | Tragic 9.3% |
| French American Indians | 3.7 /100 | #232 | Tragic 9.3% |
| Immigrants | St. Vincent and the Grenadines | 3.3 /100 | #233 | Tragic 9.3% |
| Mexicans | 3.2 /100 | #234 | Tragic 9.3% |
| Uruguayans | 3.0 /100 | #235 | Tragic 9.3% |
| Hungarians | 3.0 /100 | #236 | Tragic 9.3% |
| Immigrants | Belize | 2.8 /100 | #237 | Tragic 9.3% |