Immigrants from Taiwan vs Shoshone Unemployment Among Ages 60 to 64 years
COMPARE
Immigrants from Taiwan
Shoshone
Unemployment Among Ages 60 to 64 years
Unemployment Among Ages 60 to 64 years Comparison
Immigrants from Taiwan
Shoshone
4.8%
UNEMPLOYMENT AMONG AGES 60 TO 64 YEARS
66.0/ 100
METRIC RATING
158th/ 347
METRIC RANK
5.7%
UNEMPLOYMENT AMONG AGES 60 TO 64 YEARS
0.0/ 100
METRIC RATING
317th/ 347
METRIC RANK
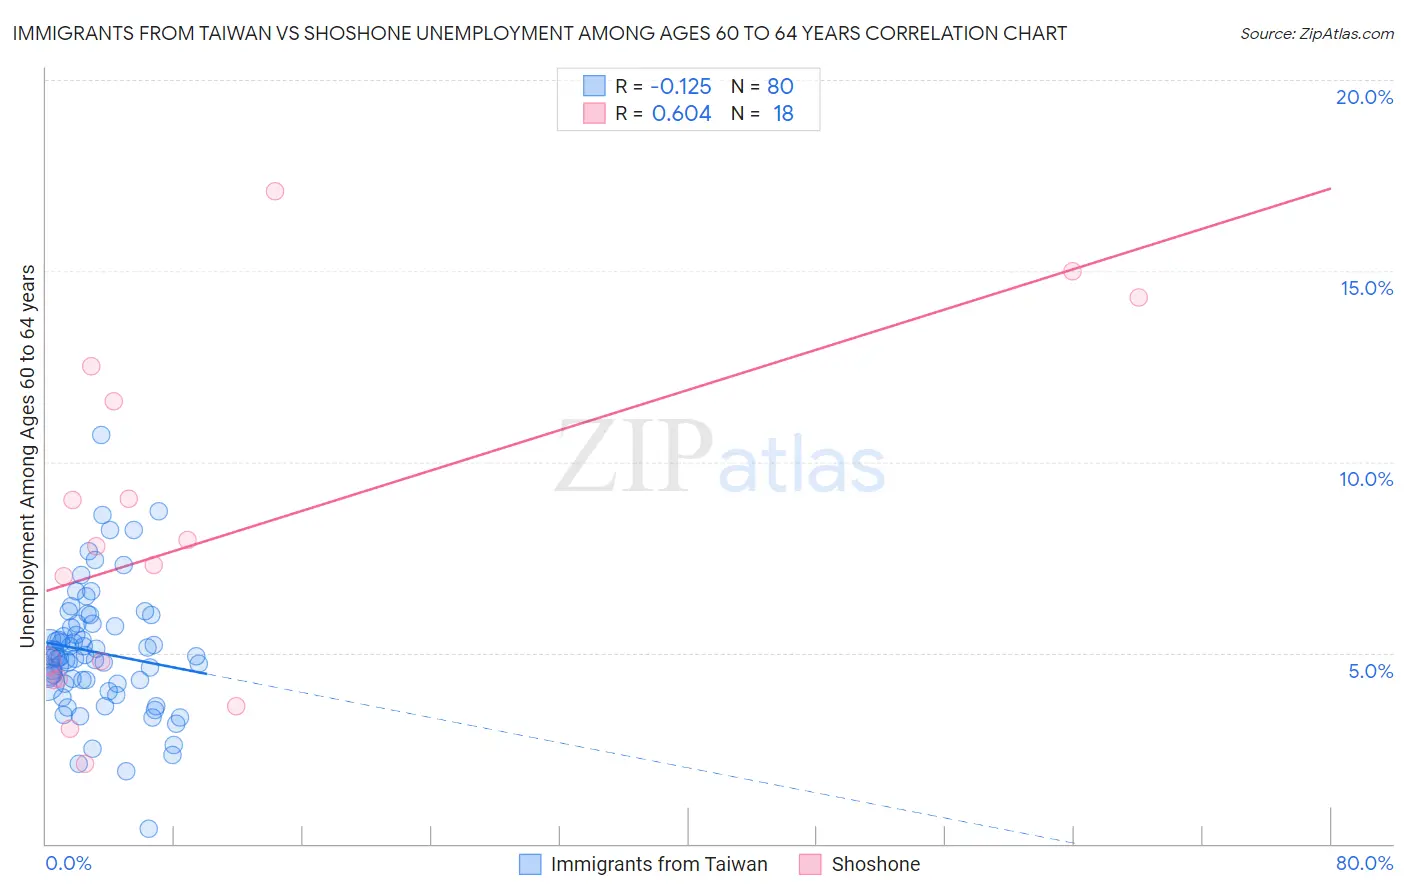
Immigrants from Taiwan vs Shoshone Unemployment Among Ages 60 to 64 years Correlation Chart
The statistical analysis conducted on geographies consisting of 278,919,372 people shows a poor negative correlation between the proportion of Immigrants from Taiwan and unemployment rate among population between the ages 60 and 64 in the United States with a correlation coefficient (R) of -0.125 and weighted average of 4.8%. Similarly, the statistical analysis conducted on geographies consisting of 63,439,226 people shows a significant positive correlation between the proportion of Shoshone and unemployment rate among population between the ages 60 and 64 in the United States with a correlation coefficient (R) of 0.604 and weighted average of 5.7%, a difference of 17.1%.
Unemployment Among Ages 60 to 64 years Correlation Summary
| Measurement | Immigrants from Taiwan | Shoshone |
| Minimum | 0.40% | 2.1% |
| Maximum | 10.7% | 17.1% |
| Range | 10.3% | 15.0% |
| Mean | 5.0% | 8.1% |
| Median | 4.9% | 7.5% |
| Interquartile 25% (IQ1) | 4.2% | 4.3% |
| Interquartile 75% (IQ3) | 5.7% | 11.6% |
| Interquartile Range (IQR) | 1.5% | 7.3% |
| Standard Deviation (Sample) | 1.6% | 4.4% |
| Standard Deviation (Population) | 1.6% | 4.3% |
Similar Demographics by Unemployment Among Ages 60 to 64 years
Demographics Similar to Immigrants from Taiwan by Unemployment Among Ages 60 to 64 years
In terms of unemployment among ages 60 to 64 years, the demographic groups most similar to Immigrants from Taiwan are Spanish (4.8%, a difference of 0.020%), Australian (4.8%, a difference of 0.030%), Immigrants from Norway (4.8%, a difference of 0.030%), South African (4.8%, a difference of 0.030%), and Laotian (4.8%, a difference of 0.040%).
| Demographics | Rating | Rank | Unemployment Among Ages 60 to 64 years |
| Immigrants | South Africa | 78.5 /100 | #151 | Good 4.8% |
| Americans | 75.7 /100 | #152 | Good 4.8% |
| Bolivians | 75.5 /100 | #153 | Good 4.8% |
| Chileans | 72.6 /100 | #154 | Good 4.8% |
| Filipinos | 72.1 /100 | #155 | Good 4.8% |
| Immigrants | Bolivia | 69.2 /100 | #156 | Good 4.8% |
| Laotians | 66.8 /100 | #157 | Good 4.8% |
| Immigrants | Taiwan | 66.0 /100 | #158 | Good 4.8% |
| Spanish | 65.5 /100 | #159 | Good 4.8% |
| Australians | 65.3 /100 | #160 | Good 4.8% |
| Immigrants | Norway | 65.1 /100 | #161 | Good 4.8% |
| South Africans | 65.1 /100 | #162 | Good 4.8% |
| Immigrants | Belgium | 64.8 /100 | #163 | Good 4.8% |
| Pakistanis | 64.6 /100 | #164 | Good 4.8% |
| Immigrants | Panama | 62.0 /100 | #165 | Good 4.8% |
Demographics Similar to Shoshone by Unemployment Among Ages 60 to 64 years
In terms of unemployment among ages 60 to 64 years, the demographic groups most similar to Shoshone are Native/Alaskan (5.7%, a difference of 0.050%), Immigrants from Belize (5.7%, a difference of 0.54%), Cheyenne (5.6%, a difference of 0.87%), Cree (5.6%, a difference of 1.2%), and Colville (5.7%, a difference of 1.3%).
| Demographics | Rating | Rank | Unemployment Among Ages 60 to 64 years |
| British West Indians | 0.0 /100 | #310 | Tragic 5.5% |
| U.S. Virgin Islanders | 0.0 /100 | #311 | Tragic 5.5% |
| Immigrants | West Indies | 0.0 /100 | #312 | Tragic 5.5% |
| Belizeans | 0.0 /100 | #313 | Tragic 5.5% |
| Guyanese | 0.0 /100 | #314 | Tragic 5.5% |
| Cree | 0.0 /100 | #315 | Tragic 5.6% |
| Cheyenne | 0.0 /100 | #316 | Tragic 5.6% |
| Shoshone | 0.0 /100 | #317 | Tragic 5.7% |
| Natives/Alaskans | 0.0 /100 | #318 | Tragic 5.7% |
| Immigrants | Belize | 0.0 /100 | #319 | Tragic 5.7% |
| Colville | 0.0 /100 | #320 | Tragic 5.7% |
| Dutch West Indians | 0.0 /100 | #321 | Tragic 5.7% |
| Ecuadorians | 0.0 /100 | #322 | Tragic 5.8% |
| Alsatians | 0.0 /100 | #323 | Tragic 5.8% |
| Immigrants | Ecuador | 0.0 /100 | #324 | Tragic 5.8% |