Immigrants from Taiwan vs Immigrants from Poland Unemployment Among Ages 60 to 64 years
COMPARE
Immigrants from Taiwan
Immigrants from Poland
Unemployment Among Ages 60 to 64 years
Unemployment Among Ages 60 to 64 years Comparison
Immigrants from Taiwan
Immigrants from Poland
4.8%
UNEMPLOYMENT AMONG AGES 60 TO 64 YEARS
66.0/ 100
METRIC RATING
158th/ 347
METRIC RANK
5.0%
UNEMPLOYMENT AMONG AGES 60 TO 64 YEARS
3.0/ 100
METRIC RATING
238th/ 347
METRIC RANK
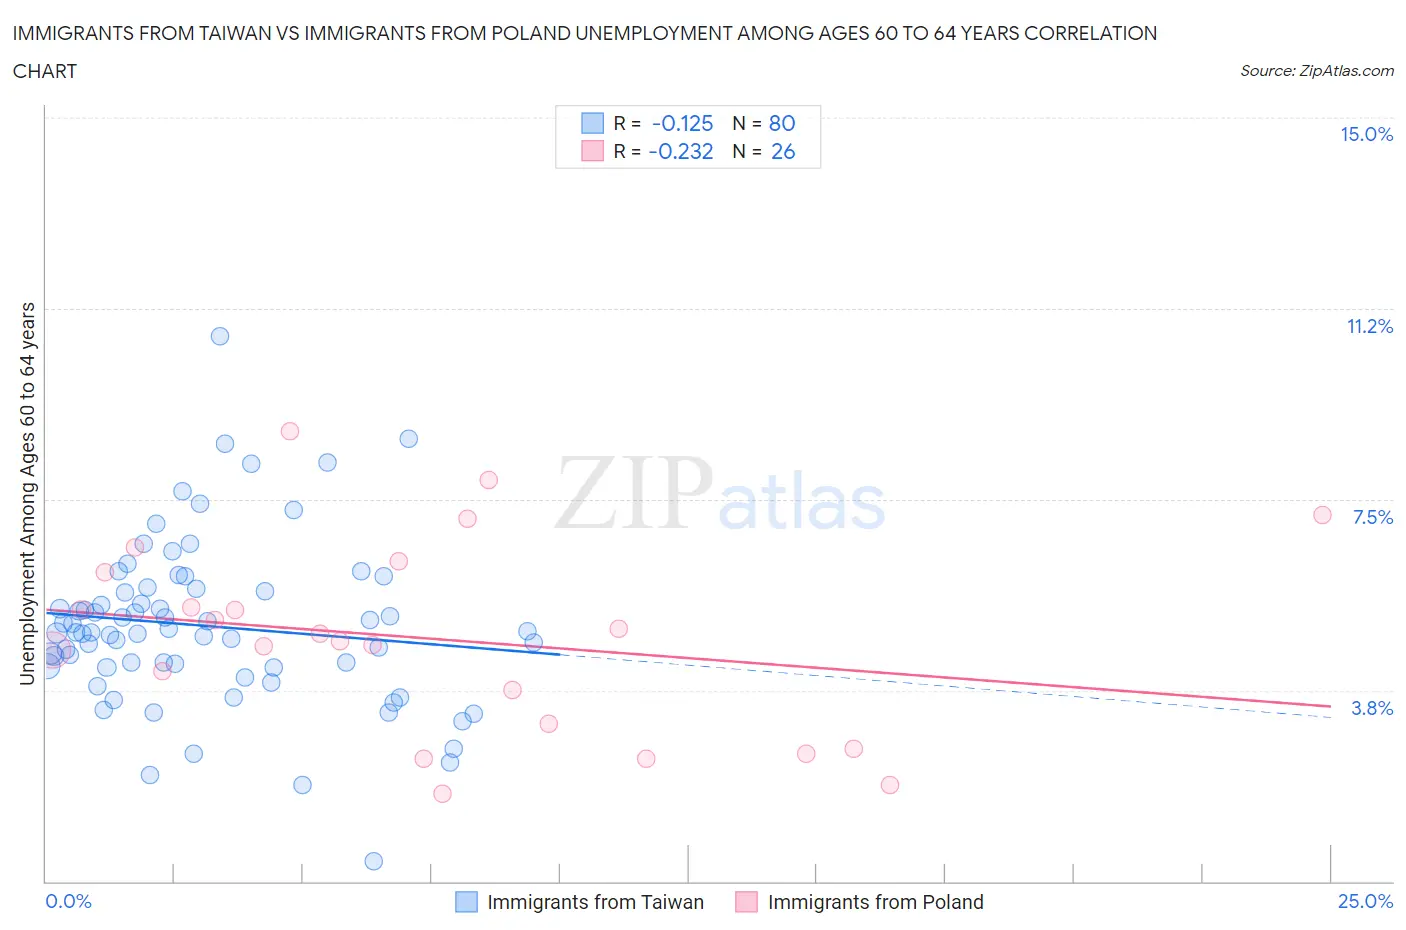
Immigrants from Taiwan vs Immigrants from Poland Unemployment Among Ages 60 to 64 years Correlation Chart
The statistical analysis conducted on geographies consisting of 278,919,372 people shows a poor negative correlation between the proportion of Immigrants from Taiwan and unemployment rate among population between the ages 60 and 64 in the United States with a correlation coefficient (R) of -0.125 and weighted average of 4.8%. Similarly, the statistical analysis conducted on geographies consisting of 283,702,985 people shows a weak negative correlation between the proportion of Immigrants from Poland and unemployment rate among population between the ages 60 and 64 in the United States with a correlation coefficient (R) of -0.232 and weighted average of 5.0%, a difference of 3.7%.
Unemployment Among Ages 60 to 64 years Correlation Summary
| Measurement | Immigrants from Taiwan | Immigrants from Poland |
| Minimum | 0.40% | 1.7% |
| Maximum | 10.7% | 8.8% |
| Range | 10.3% | 7.1% |
| Mean | 5.0% | 4.8% |
| Median | 4.9% | 4.8% |
| Interquartile 25% (IQ1) | 4.2% | 3.1% |
| Interquartile 75% (IQ3) | 5.7% | 6.1% |
| Interquartile Range (IQR) | 1.5% | 3.0% |
| Standard Deviation (Sample) | 1.6% | 1.9% |
| Standard Deviation (Population) | 1.6% | 1.9% |
Similar Demographics by Unemployment Among Ages 60 to 64 years
Demographics Similar to Immigrants from Taiwan by Unemployment Among Ages 60 to 64 years
In terms of unemployment among ages 60 to 64 years, the demographic groups most similar to Immigrants from Taiwan are Spanish (4.8%, a difference of 0.020%), Australian (4.8%, a difference of 0.030%), Immigrants from Norway (4.8%, a difference of 0.030%), South African (4.8%, a difference of 0.030%), and Laotian (4.8%, a difference of 0.040%).
| Demographics | Rating | Rank | Unemployment Among Ages 60 to 64 years |
| Immigrants | South Africa | 78.5 /100 | #151 | Good 4.8% |
| Americans | 75.7 /100 | #152 | Good 4.8% |
| Bolivians | 75.5 /100 | #153 | Good 4.8% |
| Chileans | 72.6 /100 | #154 | Good 4.8% |
| Filipinos | 72.1 /100 | #155 | Good 4.8% |
| Immigrants | Bolivia | 69.2 /100 | #156 | Good 4.8% |
| Laotians | 66.8 /100 | #157 | Good 4.8% |
| Immigrants | Taiwan | 66.0 /100 | #158 | Good 4.8% |
| Spanish | 65.5 /100 | #159 | Good 4.8% |
| Australians | 65.3 /100 | #160 | Good 4.8% |
| Immigrants | Norway | 65.1 /100 | #161 | Good 4.8% |
| South Africans | 65.1 /100 | #162 | Good 4.8% |
| Immigrants | Belgium | 64.8 /100 | #163 | Good 4.8% |
| Pakistanis | 64.6 /100 | #164 | Good 4.8% |
| Immigrants | Panama | 62.0 /100 | #165 | Good 4.8% |
Demographics Similar to Immigrants from Poland by Unemployment Among Ages 60 to 64 years
In terms of unemployment among ages 60 to 64 years, the demographic groups most similar to Immigrants from Poland are Immigrants from Western Asia (5.0%, a difference of 0.0%), Immigrants from Sierra Leone (5.0%, a difference of 0.040%), Delaware (5.0%, a difference of 0.17%), Ghanaian (5.0%, a difference of 0.18%), and Immigrants from Croatia (5.0%, a difference of 0.25%).
| Demographics | Rating | Rank | Unemployment Among Ages 60 to 64 years |
| Tohono O'odham | 5.7 /100 | #231 | Tragic 5.0% |
| Immigrants | Eastern Asia | 4.7 /100 | #232 | Tragic 5.0% |
| Immigrants | Greece | 4.6 /100 | #233 | Tragic 5.0% |
| Iranians | 4.2 /100 | #234 | Tragic 5.0% |
| Delaware | 3.6 /100 | #235 | Tragic 5.0% |
| Immigrants | Sierra Leone | 3.1 /100 | #236 | Tragic 5.0% |
| Immigrants | Western Asia | 3.0 /100 | #237 | Tragic 5.0% |
| Immigrants | Poland | 3.0 /100 | #238 | Tragic 5.0% |
| Ghanaians | 2.4 /100 | #239 | Tragic 5.0% |
| Immigrants | Croatia | 2.2 /100 | #240 | Tragic 5.0% |
| Indians (Asian) | 2.2 /100 | #241 | Tragic 5.0% |
| Argentineans | 2.1 /100 | #242 | Tragic 5.0% |
| Immigrants | Philippines | 1.9 /100 | #243 | Tragic 5.0% |
| Peruvians | 1.6 /100 | #244 | Tragic 5.0% |
| Comanche | 1.3 /100 | #245 | Tragic 5.0% |