Albanian vs Shoshone Unemployment Among Ages 60 to 64 years
COMPARE
Albanian
Shoshone
Unemployment Among Ages 60 to 64 years
Unemployment Among Ages 60 to 64 years Comparison
Albanians
Shoshone
4.7%
UNEMPLOYMENT AMONG AGES 60 TO 64 YEARS
95.3/ 100
METRIC RATING
121st/ 347
METRIC RANK
5.7%
UNEMPLOYMENT AMONG AGES 60 TO 64 YEARS
0.0/ 100
METRIC RATING
317th/ 347
METRIC RANK
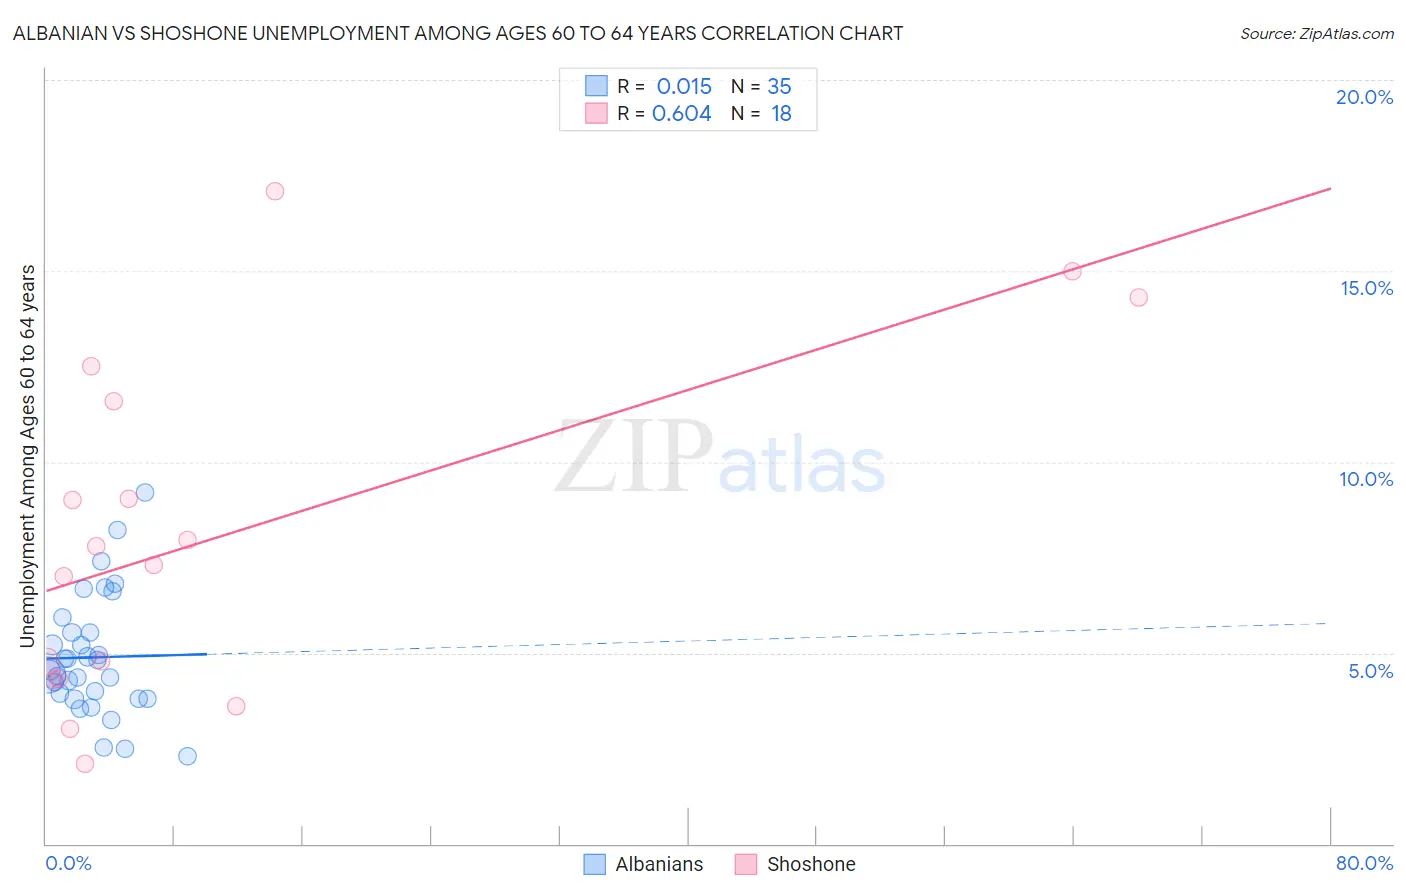
Albanian vs Shoshone Unemployment Among Ages 60 to 64 years Correlation Chart
The statistical analysis conducted on geographies consisting of 182,876,519 people shows no correlation between the proportion of Albanians and unemployment rate among population between the ages 60 and 64 in the United States with a correlation coefficient (R) of 0.015 and weighted average of 4.7%. Similarly, the statistical analysis conducted on geographies consisting of 63,439,226 people shows a significant positive correlation between the proportion of Shoshone and unemployment rate among population between the ages 60 and 64 in the United States with a correlation coefficient (R) of 0.604 and weighted average of 5.7%, a difference of 19.6%.
Unemployment Among Ages 60 to 64 years Correlation Summary
| Measurement | Albanian | Shoshone |
| Minimum | 2.3% | 2.1% |
| Maximum | 9.2% | 17.1% |
| Range | 6.9% | 15.0% |
| Mean | 4.9% | 8.1% |
| Median | 4.6% | 7.5% |
| Interquartile 25% (IQ1) | 3.8% | 4.3% |
| Interquartile 75% (IQ3) | 5.5% | 11.6% |
| Interquartile Range (IQR) | 1.7% | 7.3% |
| Standard Deviation (Sample) | 1.6% | 4.4% |
| Standard Deviation (Population) | 1.5% | 4.3% |
Similar Demographics by Unemployment Among Ages 60 to 64 years
Demographics Similar to Albanians by Unemployment Among Ages 60 to 64 years
In terms of unemployment among ages 60 to 64 years, the demographic groups most similar to Albanians are Immigrants from Kazakhstan (4.7%, a difference of 0.030%), Macedonian (4.7%, a difference of 0.080%), Immigrants from Morocco (4.7%, a difference of 0.090%), Finnish (4.7%, a difference of 0.11%), and Immigrants from Senegal (4.7%, a difference of 0.14%).
| Demographics | Rating | Rank | Unemployment Among Ages 60 to 64 years |
| Maltese | 96.5 /100 | #114 | Exceptional 4.7% |
| Immigrants | Romania | 96.4 /100 | #115 | Exceptional 4.7% |
| Immigrants | England | 96.3 /100 | #116 | Exceptional 4.7% |
| Immigrants | Germany | 96.3 /100 | #117 | Exceptional 4.7% |
| Ukrainians | 96.1 /100 | #118 | Exceptional 4.7% |
| Immigrants | Morocco | 95.7 /100 | #119 | Exceptional 4.7% |
| Macedonians | 95.7 /100 | #120 | Exceptional 4.7% |
| Albanians | 95.3 /100 | #121 | Exceptional 4.7% |
| Immigrants | Kazakhstan | 95.1 /100 | #122 | Exceptional 4.7% |
| Finns | 94.7 /100 | #123 | Exceptional 4.7% |
| Immigrants | Senegal | 94.5 /100 | #124 | Exceptional 4.7% |
| Immigrants | Thailand | 93.7 /100 | #125 | Exceptional 4.7% |
| Immigrants | South Central Asia | 93.0 /100 | #126 | Exceptional 4.7% |
| Austrians | 91.9 /100 | #127 | Exceptional 4.8% |
| Choctaw | 90.3 /100 | #128 | Exceptional 4.8% |
Demographics Similar to Shoshone by Unemployment Among Ages 60 to 64 years
In terms of unemployment among ages 60 to 64 years, the demographic groups most similar to Shoshone are Native/Alaskan (5.7%, a difference of 0.050%), Immigrants from Belize (5.7%, a difference of 0.54%), Cheyenne (5.6%, a difference of 0.87%), Cree (5.6%, a difference of 1.2%), and Colville (5.7%, a difference of 1.3%).
| Demographics | Rating | Rank | Unemployment Among Ages 60 to 64 years |
| British West Indians | 0.0 /100 | #310 | Tragic 5.5% |
| U.S. Virgin Islanders | 0.0 /100 | #311 | Tragic 5.5% |
| Immigrants | West Indies | 0.0 /100 | #312 | Tragic 5.5% |
| Belizeans | 0.0 /100 | #313 | Tragic 5.5% |
| Guyanese | 0.0 /100 | #314 | Tragic 5.5% |
| Cree | 0.0 /100 | #315 | Tragic 5.6% |
| Cheyenne | 0.0 /100 | #316 | Tragic 5.6% |
| Shoshone | 0.0 /100 | #317 | Tragic 5.7% |
| Natives/Alaskans | 0.0 /100 | #318 | Tragic 5.7% |
| Immigrants | Belize | 0.0 /100 | #319 | Tragic 5.7% |
| Colville | 0.0 /100 | #320 | Tragic 5.7% |
| Dutch West Indians | 0.0 /100 | #321 | Tragic 5.7% |
| Ecuadorians | 0.0 /100 | #322 | Tragic 5.8% |
| Alsatians | 0.0 /100 | #323 | Tragic 5.8% |
| Immigrants | Ecuador | 0.0 /100 | #324 | Tragic 5.8% |