Immigrants from Taiwan vs Bermudan Unemployment Among Ages 60 to 64 years
COMPARE
Immigrants from Taiwan
Bermudan
Unemployment Among Ages 60 to 64 years
Unemployment Among Ages 60 to 64 years Comparison
Immigrants from Taiwan
Bermudans
4.8%
UNEMPLOYMENT AMONG AGES 60 TO 64 YEARS
66.0/ 100
METRIC RATING
158th/ 347
METRIC RANK
4.9%
UNEMPLOYMENT AMONG AGES 60 TO 64 YEARS
46.5/ 100
METRIC RATING
176th/ 347
METRIC RANK
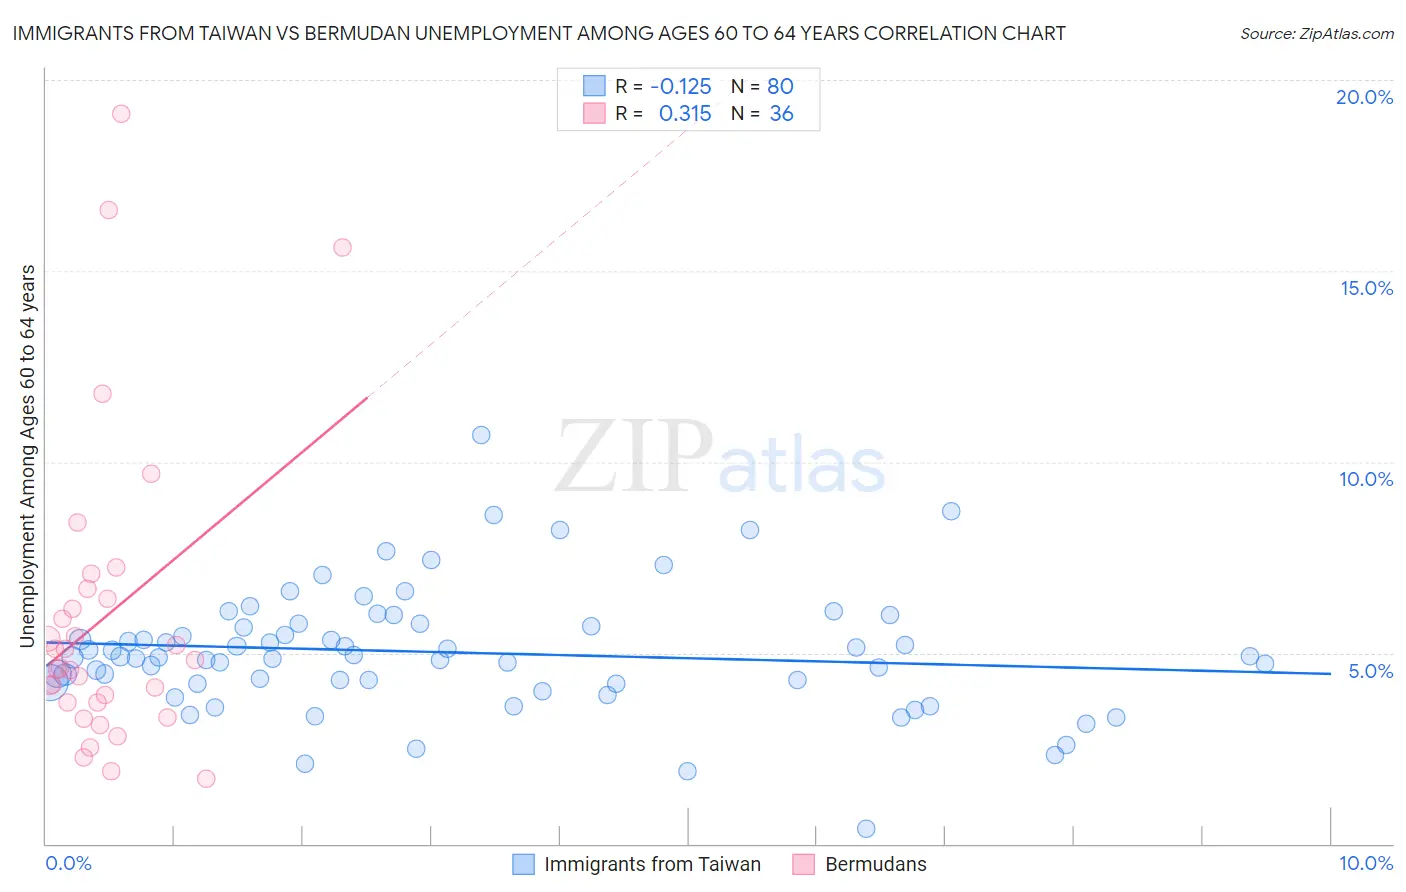
Immigrants from Taiwan vs Bermudan Unemployment Among Ages 60 to 64 years Correlation Chart
The statistical analysis conducted on geographies consisting of 278,919,372 people shows a poor negative correlation between the proportion of Immigrants from Taiwan and unemployment rate among population between the ages 60 and 64 in the United States with a correlation coefficient (R) of -0.125 and weighted average of 4.8%. Similarly, the statistical analysis conducted on geographies consisting of 54,445,142 people shows a mild positive correlation between the proportion of Bermudans and unemployment rate among population between the ages 60 and 64 in the United States with a correlation coefficient (R) of 0.315 and weighted average of 4.9%, a difference of 0.71%.
Unemployment Among Ages 60 to 64 years Correlation Summary
| Measurement | Immigrants from Taiwan | Bermudan |
| Minimum | 0.40% | 1.7% |
| Maximum | 10.7% | 19.1% |
| Range | 10.3% | 17.4% |
| Mean | 5.0% | 6.0% |
| Median | 4.9% | 4.7% |
| Interquartile 25% (IQ1) | 4.2% | 3.7% |
| Interquartile 75% (IQ3) | 5.7% | 6.5% |
| Interquartile Range (IQR) | 1.5% | 2.8% |
| Standard Deviation (Sample) | 1.6% | 4.0% |
| Standard Deviation (Population) | 1.6% | 4.0% |
Demographics Similar to Immigrants from Taiwan and Bermudans by Unemployment Among Ages 60 to 64 years
In terms of unemployment among ages 60 to 64 years, the demographic groups most similar to Immigrants from Taiwan are Spanish (4.8%, a difference of 0.020%), Australian (4.8%, a difference of 0.030%), Immigrants from Norway (4.8%, a difference of 0.030%), South African (4.8%, a difference of 0.030%), and Laotian (4.8%, a difference of 0.040%). Similarly, the demographic groups most similar to Bermudans are Immigrants from Latvia (4.9%, a difference of 0.010%), Immigrants from Malaysia (4.9%, a difference of 0.070%), Immigrants from Western Europe (4.9%, a difference of 0.12%), Immigrants from Hungary (4.9%, a difference of 0.13%), and Immigrants from Turkey (4.9%, a difference of 0.22%).
| Demographics | Rating | Rank | Unemployment Among Ages 60 to 64 years |
| Laotians | 66.8 /100 | #157 | Good 4.8% |
| Immigrants | Taiwan | 66.0 /100 | #158 | Good 4.8% |
| Spanish | 65.5 /100 | #159 | Good 4.8% |
| Australians | 65.3 /100 | #160 | Good 4.8% |
| Immigrants | Norway | 65.1 /100 | #161 | Good 4.8% |
| South Africans | 65.1 /100 | #162 | Good 4.8% |
| Immigrants | Belgium | 64.8 /100 | #163 | Good 4.8% |
| Pakistanis | 64.6 /100 | #164 | Good 4.8% |
| Immigrants | Panama | 62.0 /100 | #165 | Good 4.8% |
| Palestinians | 60.5 /100 | #166 | Good 4.8% |
| Immigrants | Northern Europe | 59.1 /100 | #167 | Average 4.8% |
| Immigrants | Southern Europe | 56.7 /100 | #168 | Average 4.8% |
| Immigrants | France | 55.5 /100 | #169 | Average 4.8% |
| Immigrants | Korea | 54.2 /100 | #170 | Average 4.8% |
| Samoans | 53.6 /100 | #171 | Average 4.9% |
| Immigrants | Turkey | 52.8 /100 | #172 | Average 4.9% |
| Immigrants | Hungary | 50.2 /100 | #173 | Average 4.9% |
| Immigrants | Western Europe | 50.0 /100 | #174 | Average 4.9% |
| Immigrants | Latvia | 46.9 /100 | #175 | Average 4.9% |
| Bermudans | 46.5 /100 | #176 | Average 4.9% |
| Immigrants | Malaysia | 44.7 /100 | #177 | Average 4.9% |