Slavic vs Shoshone Unemployment Among Ages 60 to 64 years
COMPARE
Slavic
Shoshone
Unemployment Among Ages 60 to 64 years
Unemployment Among Ages 60 to 64 years Comparison
Slavs
Shoshone
4.6%
UNEMPLOYMENT AMONG AGES 60 TO 64 YEARS
99.5/ 100
METRIC RATING
71st/ 347
METRIC RANK
5.7%
UNEMPLOYMENT AMONG AGES 60 TO 64 YEARS
0.0/ 100
METRIC RATING
317th/ 347
METRIC RANK
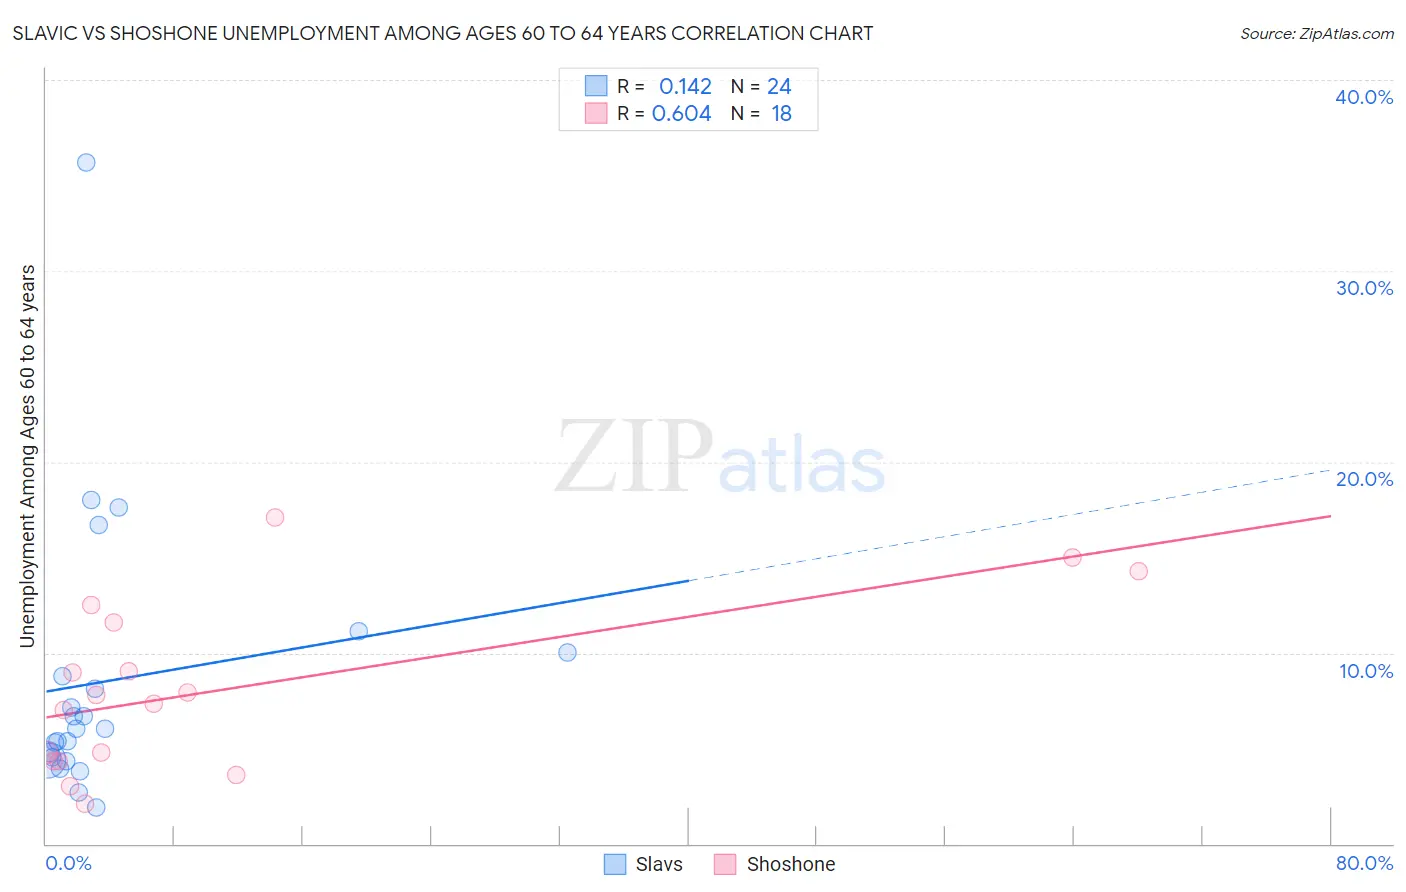
Slavic vs Shoshone Unemployment Among Ages 60 to 64 years Correlation Chart
The statistical analysis conducted on geographies consisting of 250,860,466 people shows a poor positive correlation between the proportion of Slavs and unemployment rate among population between the ages 60 and 64 in the United States with a correlation coefficient (R) of 0.142 and weighted average of 4.6%. Similarly, the statistical analysis conducted on geographies consisting of 63,439,226 people shows a significant positive correlation between the proportion of Shoshone and unemployment rate among population between the ages 60 and 64 in the United States with a correlation coefficient (R) of 0.604 and weighted average of 5.7%, a difference of 22.1%.
Unemployment Among Ages 60 to 64 years Correlation Summary
| Measurement | Slavic | Shoshone |
| Minimum | 1.9% | 2.1% |
| Maximum | 35.7% | 17.1% |
| Range | 33.8% | 15.0% |
| Mean | 8.5% | 8.1% |
| Median | 6.0% | 7.5% |
| Interquartile 25% (IQ1) | 4.4% | 4.3% |
| Interquartile 75% (IQ3) | 9.4% | 11.6% |
| Interquartile Range (IQR) | 4.9% | 7.3% |
| Standard Deviation (Sample) | 7.3% | 4.4% |
| Standard Deviation (Population) | 7.1% | 4.3% |
Similar Demographics by Unemployment Among Ages 60 to 64 years
Demographics Similar to Slavs by Unemployment Among Ages 60 to 64 years
In terms of unemployment among ages 60 to 64 years, the demographic groups most similar to Slavs are Tongan (4.6%, a difference of 0.010%), Immigrants from Eastern Africa (4.6%, a difference of 0.030%), Croatian (4.6%, a difference of 0.080%), Creek (4.6%, a difference of 0.16%), and Northern European (4.6%, a difference of 0.21%).
| Demographics | Rating | Rank | Unemployment Among Ages 60 to 64 years |
| Immigrants | Middle Africa | 99.7 /100 | #64 | Exceptional 4.6% |
| Jordanians | 99.7 /100 | #65 | Exceptional 4.6% |
| Hawaiians | 99.6 /100 | #66 | Exceptional 4.6% |
| Immigrants | Scotland | 99.6 /100 | #67 | Exceptional 4.6% |
| Immigrants | Laos | 99.6 /100 | #68 | Exceptional 4.6% |
| Creek | 99.6 /100 | #69 | Exceptional 4.6% |
| Croatians | 99.5 /100 | #70 | Exceptional 4.6% |
| Slavs | 99.5 /100 | #71 | Exceptional 4.6% |
| Tongans | 99.5 /100 | #72 | Exceptional 4.6% |
| Immigrants | Eastern Africa | 99.5 /100 | #73 | Exceptional 4.6% |
| Northern Europeans | 99.3 /100 | #74 | Exceptional 4.6% |
| Potawatomi | 99.3 /100 | #75 | Exceptional 4.6% |
| Slovaks | 99.3 /100 | #76 | Exceptional 4.6% |
| Immigrants | Somalia | 99.2 /100 | #77 | Exceptional 4.6% |
| Seminole | 99.2 /100 | #78 | Exceptional 4.7% |
Demographics Similar to Shoshone by Unemployment Among Ages 60 to 64 years
In terms of unemployment among ages 60 to 64 years, the demographic groups most similar to Shoshone are Native/Alaskan (5.7%, a difference of 0.050%), Immigrants from Belize (5.7%, a difference of 0.54%), Cheyenne (5.6%, a difference of 0.87%), Cree (5.6%, a difference of 1.2%), and Colville (5.7%, a difference of 1.3%).
| Demographics | Rating | Rank | Unemployment Among Ages 60 to 64 years |
| British West Indians | 0.0 /100 | #310 | Tragic 5.5% |
| U.S. Virgin Islanders | 0.0 /100 | #311 | Tragic 5.5% |
| Immigrants | West Indies | 0.0 /100 | #312 | Tragic 5.5% |
| Belizeans | 0.0 /100 | #313 | Tragic 5.5% |
| Guyanese | 0.0 /100 | #314 | Tragic 5.5% |
| Cree | 0.0 /100 | #315 | Tragic 5.6% |
| Cheyenne | 0.0 /100 | #316 | Tragic 5.6% |
| Shoshone | 0.0 /100 | #317 | Tragic 5.7% |
| Natives/Alaskans | 0.0 /100 | #318 | Tragic 5.7% |
| Immigrants | Belize | 0.0 /100 | #319 | Tragic 5.7% |
| Colville | 0.0 /100 | #320 | Tragic 5.7% |
| Dutch West Indians | 0.0 /100 | #321 | Tragic 5.7% |
| Ecuadorians | 0.0 /100 | #322 | Tragic 5.8% |
| Alsatians | 0.0 /100 | #323 | Tragic 5.8% |
| Immigrants | Ecuador | 0.0 /100 | #324 | Tragic 5.8% |