Immigrants from Taiwan vs Immigrants from Ethiopia Unemployment Among Ages 60 to 64 years
COMPARE
Immigrants from Taiwan
Immigrants from Ethiopia
Unemployment Among Ages 60 to 64 years
Unemployment Among Ages 60 to 64 years Comparison
Immigrants from Taiwan
Immigrants from Ethiopia
4.8%
UNEMPLOYMENT AMONG AGES 60 TO 64 YEARS
66.0/ 100
METRIC RATING
158th/ 347
METRIC RANK
4.8%
UNEMPLOYMENT AMONG AGES 60 TO 64 YEARS
85.3/ 100
METRIC RATING
142nd/ 347
METRIC RANK
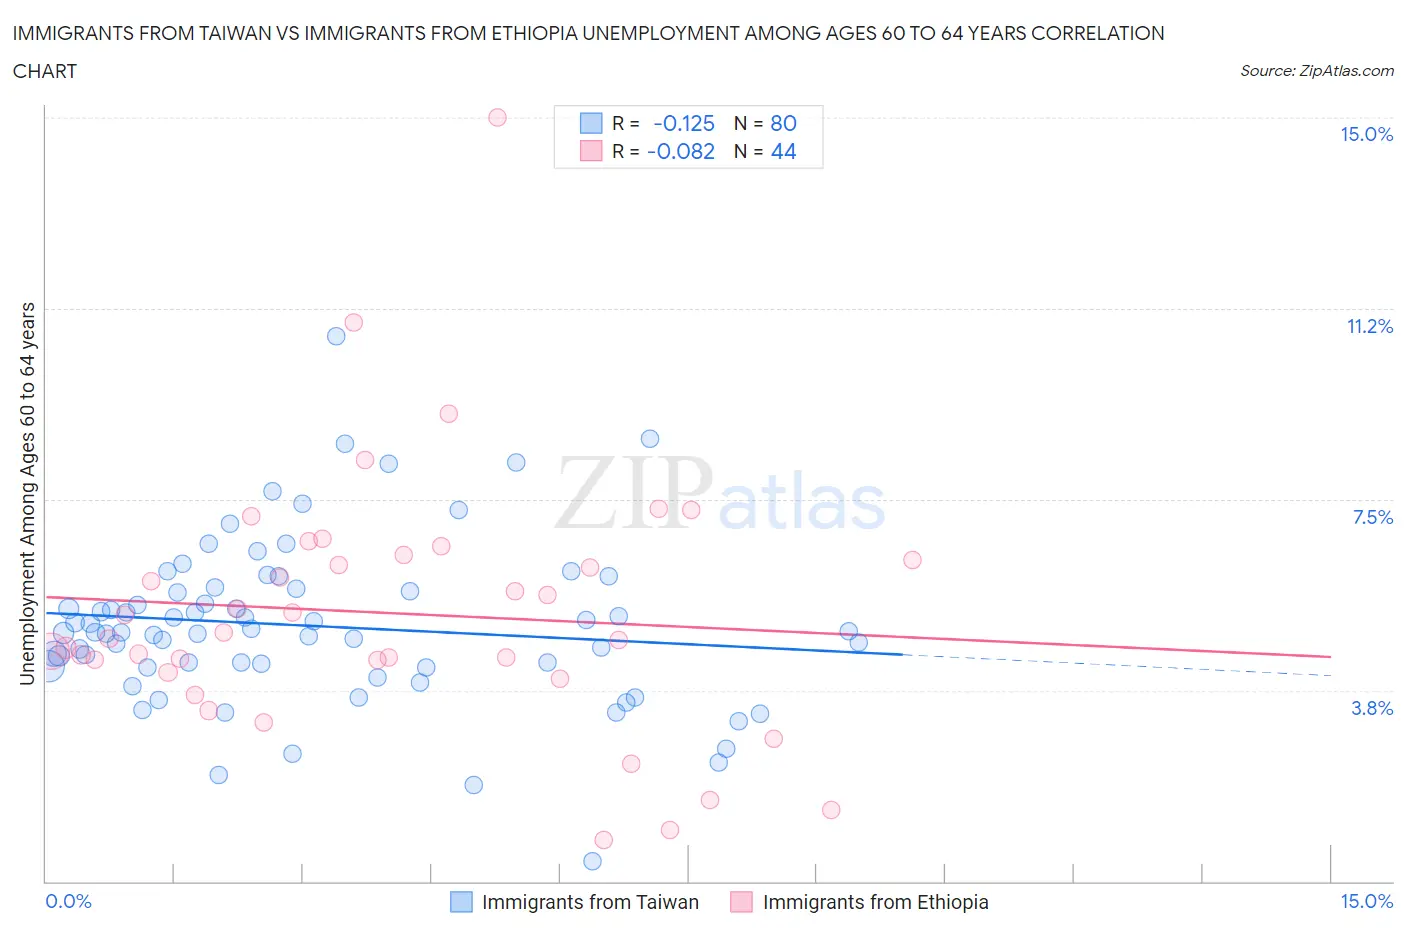
Immigrants from Taiwan vs Immigrants from Ethiopia Unemployment Among Ages 60 to 64 years Correlation Chart
The statistical analysis conducted on geographies consisting of 278,919,372 people shows a poor negative correlation between the proportion of Immigrants from Taiwan and unemployment rate among population between the ages 60 and 64 in the United States with a correlation coefficient (R) of -0.125 and weighted average of 4.8%. Similarly, the statistical analysis conducted on geographies consisting of 200,053,248 people shows a slight negative correlation between the proportion of Immigrants from Ethiopia and unemployment rate among population between the ages 60 and 64 in the United States with a correlation coefficient (R) of -0.082 and weighted average of 4.8%, a difference of 0.99%.
Unemployment Among Ages 60 to 64 years Correlation Summary
| Measurement | Immigrants from Taiwan | Immigrants from Ethiopia |
| Minimum | 0.40% | 0.80% |
| Maximum | 10.7% | 15.0% |
| Range | 10.3% | 14.2% |
| Mean | 5.0% | 5.3% |
| Median | 4.9% | 4.8% |
| Interquartile 25% (IQ1) | 4.2% | 4.2% |
| Interquartile 75% (IQ3) | 5.7% | 6.4% |
| Interquartile Range (IQR) | 1.5% | 2.1% |
| Standard Deviation (Sample) | 1.6% | 2.5% |
| Standard Deviation (Population) | 1.6% | 2.5% |
Demographics Similar to Immigrants from Taiwan and Immigrants from Ethiopia by Unemployment Among Ages 60 to 64 years
In terms of unemployment among ages 60 to 64 years, the demographic groups most similar to Immigrants from Taiwan are Spanish (4.8%, a difference of 0.020%), Australian (4.8%, a difference of 0.030%), Laotian (4.8%, a difference of 0.040%), Immigrants from Bolivia (4.8%, a difference of 0.13%), and Filipino (4.8%, a difference of 0.26%). Similarly, the demographic groups most similar to Immigrants from Ethiopia are Panamanian (4.8%, a difference of 0.010%), Italian (4.8%, a difference of 0.020%), Pima (4.8%, a difference of 0.030%), Immigrants from Pakistan (4.8%, a difference of 0.14%), and Burmese (4.8%, a difference of 0.15%).
| Demographics | Rating | Rank | Unemployment Among Ages 60 to 64 years |
| Pima | 85.8 /100 | #140 | Excellent 4.8% |
| Panamanians | 85.5 /100 | #141 | Excellent 4.8% |
| Immigrants | Ethiopia | 85.3 /100 | #142 | Excellent 4.8% |
| Italians | 85.0 /100 | #143 | Excellent 4.8% |
| Immigrants | Pakistan | 83.3 /100 | #144 | Excellent 4.8% |
| Burmese | 83.1 /100 | #145 | Excellent 4.8% |
| Turks | 81.9 /100 | #146 | Excellent 4.8% |
| Mongolians | 81.2 /100 | #147 | Excellent 4.8% |
| Latvians | 79.1 /100 | #148 | Good 4.8% |
| Arabs | 78.8 /100 | #149 | Good 4.8% |
| Immigrants | Italy | 78.7 /100 | #150 | Good 4.8% |
| Immigrants | South Africa | 78.5 /100 | #151 | Good 4.8% |
| Americans | 75.7 /100 | #152 | Good 4.8% |
| Bolivians | 75.5 /100 | #153 | Good 4.8% |
| Chileans | 72.6 /100 | #154 | Good 4.8% |
| Filipinos | 72.1 /100 | #155 | Good 4.8% |
| Immigrants | Bolivia | 69.2 /100 | #156 | Good 4.8% |
| Laotians | 66.8 /100 | #157 | Good 4.8% |
| Immigrants | Taiwan | 66.0 /100 | #158 | Good 4.8% |
| Spanish | 65.5 /100 | #159 | Good 4.8% |
| Australians | 65.3 /100 | #160 | Good 4.8% |