Kiowa vs Shoshone Unemployment Among Ages 60 to 64 years
COMPARE
Kiowa
Shoshone
Unemployment Among Ages 60 to 64 years
Unemployment Among Ages 60 to 64 years Comparison
Kiowa
Shoshone
6.2%
UNEMPLOYMENT AMONG AGES 60 TO 64 YEARS
0.0/ 100
METRIC RATING
336th/ 347
METRIC RANK
5.7%
UNEMPLOYMENT AMONG AGES 60 TO 64 YEARS
0.0/ 100
METRIC RATING
317th/ 347
METRIC RANK
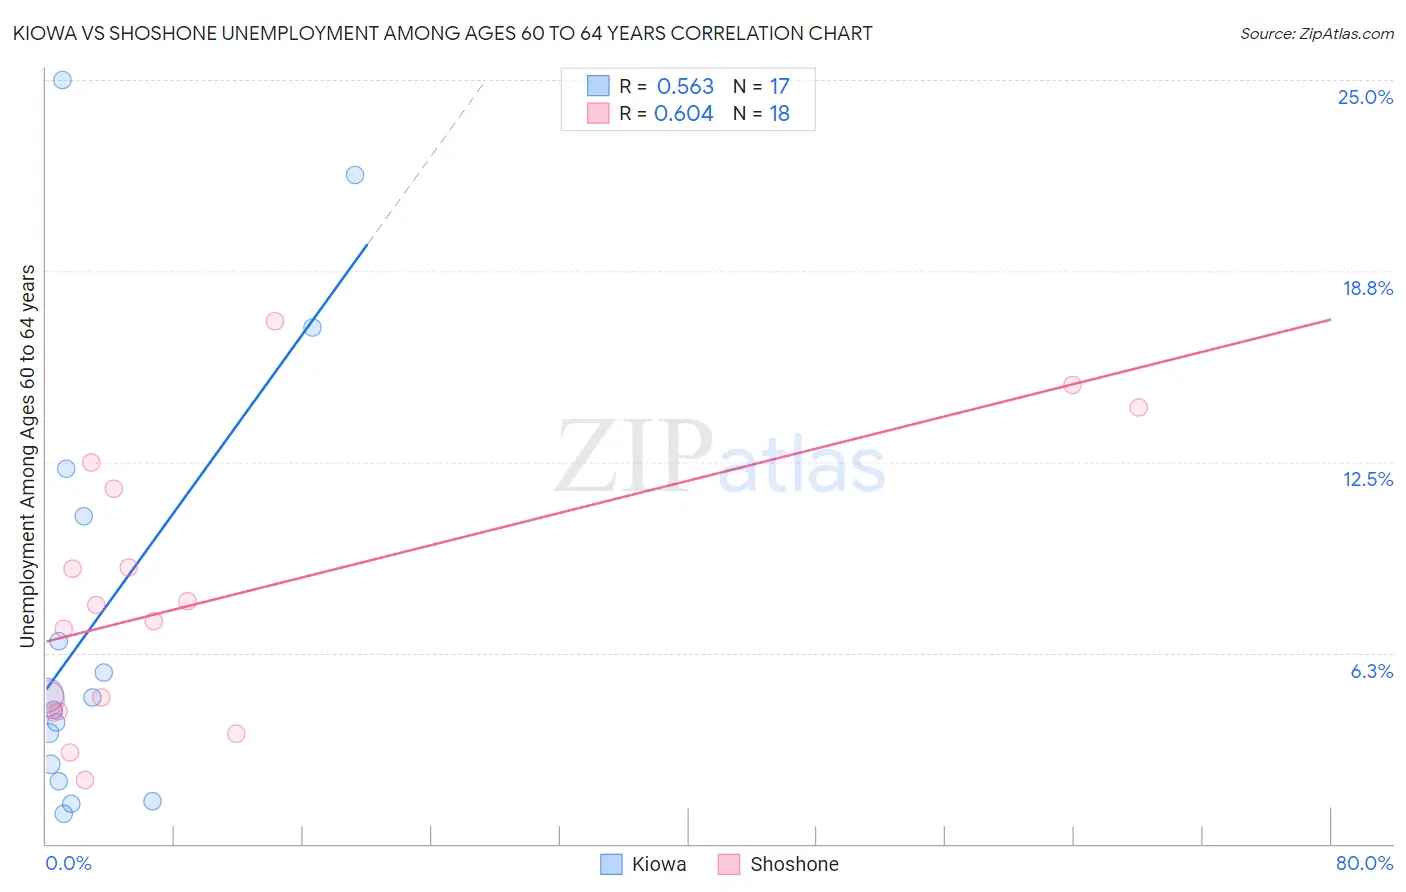
Kiowa vs Shoshone Unemployment Among Ages 60 to 64 years Correlation Chart
The statistical analysis conducted on geographies consisting of 54,128,146 people shows a substantial positive correlation between the proportion of Kiowa and unemployment rate among population between the ages 60 and 64 in the United States with a correlation coefficient (R) of 0.563 and weighted average of 6.2%. Similarly, the statistical analysis conducted on geographies consisting of 63,439,226 people shows a significant positive correlation between the proportion of Shoshone and unemployment rate among population between the ages 60 and 64 in the United States with a correlation coefficient (R) of 0.604 and weighted average of 5.7%, a difference of 9.6%.
Unemployment Among Ages 60 to 64 years Correlation Summary
| Measurement | Kiowa | Shoshone |
| Minimum | 0.98% | 2.1% |
| Maximum | 25.0% | 17.1% |
| Range | 24.0% | 15.0% |
| Mean | 7.6% | 8.1% |
| Median | 4.8% | 7.5% |
| Interquartile 25% (IQ1) | 2.3% | 4.3% |
| Interquartile 75% (IQ3) | 11.5% | 11.6% |
| Interquartile Range (IQR) | 9.2% | 7.3% |
| Standard Deviation (Sample) | 7.3% | 4.4% |
| Standard Deviation (Population) | 7.1% | 4.3% |
Demographics Similar to Kiowa and Shoshone by Unemployment Among Ages 60 to 64 years
In terms of unemployment among ages 60 to 64 years, the demographic groups most similar to Kiowa are Vietnamese (6.1%, a difference of 2.0%), Puerto Rican (6.1%, a difference of 2.1%), Immigrants from Dominican Republic (6.0%, a difference of 3.4%), Dominican (6.0%, a difference of 3.7%), and Yakama (6.0%, a difference of 3.8%). Similarly, the demographic groups most similar to Shoshone are Native/Alaskan (5.7%, a difference of 0.050%), Immigrants from Belize (5.7%, a difference of 0.54%), Cheyenne (5.6%, a difference of 0.87%), Colville (5.7%, a difference of 1.3%), and Dutch West Indian (5.7%, a difference of 1.3%).
| Demographics | Rating | Rank | Unemployment Among Ages 60 to 64 years |
| Cheyenne | 0.0 /100 | #316 | Tragic 5.6% |
| Shoshone | 0.0 /100 | #317 | Tragic 5.7% |
| Natives/Alaskans | 0.0 /100 | #318 | Tragic 5.7% |
| Immigrants | Belize | 0.0 /100 | #319 | Tragic 5.7% |
| Colville | 0.0 /100 | #320 | Tragic 5.7% |
| Dutch West Indians | 0.0 /100 | #321 | Tragic 5.7% |
| Ecuadorians | 0.0 /100 | #322 | Tragic 5.8% |
| Alsatians | 0.0 /100 | #323 | Tragic 5.8% |
| Immigrants | Ecuador | 0.0 /100 | #324 | Tragic 5.8% |
| Paiute | 0.0 /100 | #325 | Tragic 5.8% |
| Immigrants | St. Vincent and the Grenadines | 0.0 /100 | #326 | Tragic 5.9% |
| Immigrants | Grenada | 0.0 /100 | #327 | Tragic 5.9% |
| Apache | 0.0 /100 | #328 | Tragic 6.0% |
| Immigrants | Bangladesh | 0.0 /100 | #329 | Tragic 6.0% |
| Immigrants | Armenia | 0.0 /100 | #330 | Tragic 6.0% |
| Yakama | 0.0 /100 | #331 | Tragic 6.0% |
| Dominicans | 0.0 /100 | #332 | Tragic 6.0% |
| Immigrants | Dominican Republic | 0.0 /100 | #333 | Tragic 6.0% |
| Puerto Ricans | 0.0 /100 | #334 | Tragic 6.1% |
| Vietnamese | 0.0 /100 | #335 | Tragic 6.1% |
| Kiowa | 0.0 /100 | #336 | Tragic 6.2% |