Immigrants from Syria vs Immigrants from Russia Unemployment Among Women with Children Under 6 years
COMPARE
Immigrants from Syria
Immigrants from Russia
Unemployment Among Women with Children Under 6 years
Unemployment Among Women with Children Under 6 years Comparison
Immigrants from Syria
Immigrants from Russia
7.8%
UNEMPLOYMENT AMONG WOMEN WITH CHILDREN UNDER 6 YEARS
18.9/ 100
METRIC RATING
208th/ 347
METRIC RANK
6.7%
UNEMPLOYMENT AMONG WOMEN WITH CHILDREN UNDER 6 YEARS
100.0/ 100
METRIC RATING
39th/ 347
METRIC RANK
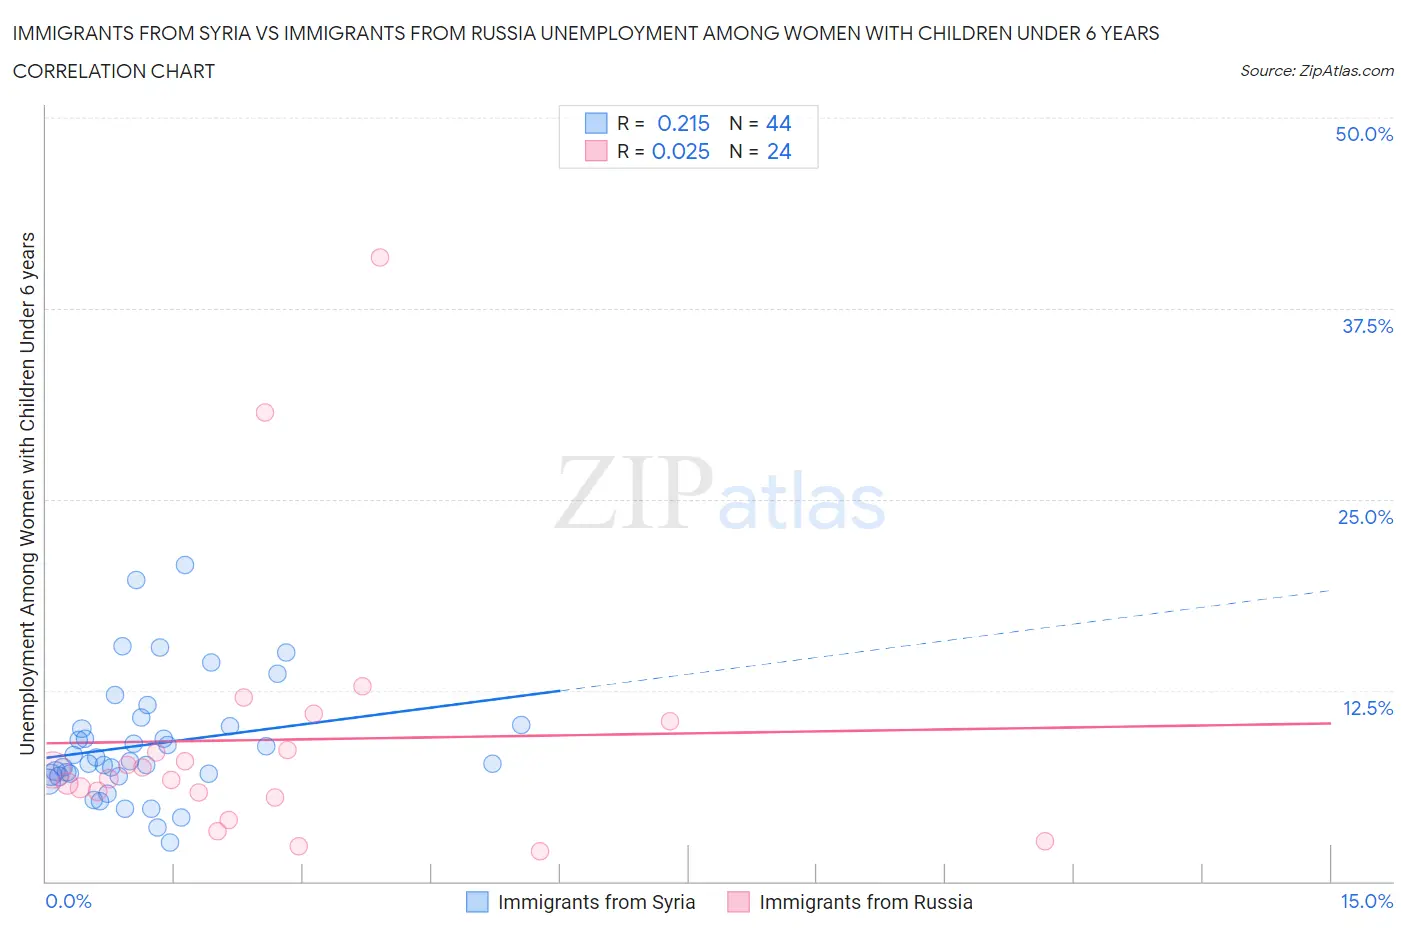
Immigrants from Syria vs Immigrants from Russia Unemployment Among Women with Children Under 6 years Correlation Chart
The statistical analysis conducted on geographies consisting of 150,011,263 people shows a weak positive correlation between the proportion of Immigrants from Syria and unemployment rate among women with children under the age of 6 in the United States with a correlation coefficient (R) of 0.215 and weighted average of 7.8%. Similarly, the statistical analysis conducted on geographies consisting of 268,851,554 people shows no correlation between the proportion of Immigrants from Russia and unemployment rate among women with children under the age of 6 in the United States with a correlation coefficient (R) of 0.025 and weighted average of 6.7%, a difference of 17.6%.
Unemployment Among Women with Children Under 6 years Correlation Summary
| Measurement | Immigrants from Syria | Immigrants from Russia |
| Minimum | 2.5% | 2.0% |
| Maximum | 20.7% | 40.8% |
| Range | 18.2% | 38.8% |
| Mean | 9.0% | 9.3% |
| Median | 7.8% | 7.0% |
| Interquartile 25% (IQ1) | 6.9% | 5.7% |
| Interquartile 75% (IQ3) | 10.2% | 9.5% |
| Interquartile Range (IQR) | 3.3% | 3.9% |
| Standard Deviation (Sample) | 3.9% | 8.8% |
| Standard Deviation (Population) | 3.9% | 8.6% |
Similar Demographics by Unemployment Among Women with Children Under 6 years
Demographics Similar to Immigrants from Syria by Unemployment Among Women with Children Under 6 years
In terms of unemployment among women with children under 6 years, the demographic groups most similar to Immigrants from Syria are Costa Rican (7.8%, a difference of 0.14%), Canadian (7.8%, a difference of 0.18%), Hungarian (7.8%, a difference of 0.23%), Immigrants (7.8%, a difference of 0.25%), and Polish (7.9%, a difference of 0.32%).
| Demographics | Rating | Rank | Unemployment Among Women with Children Under 6 years |
| Basques | 24.7 /100 | #201 | Fair 7.8% |
| Sudanese | 23.5 /100 | #202 | Fair 7.8% |
| Spaniards | 23.3 /100 | #203 | Fair 7.8% |
| Lebanese | 22.2 /100 | #204 | Fair 7.8% |
| Immigrants | Immigrants | 21.4 /100 | #205 | Fair 7.8% |
| Hungarians | 21.2 /100 | #206 | Fair 7.8% |
| Canadians | 20.6 /100 | #207 | Fair 7.8% |
| Immigrants | Syria | 18.9 /100 | #208 | Poor 7.8% |
| Costa Ricans | 17.6 /100 | #209 | Poor 7.8% |
| Poles | 16.0 /100 | #210 | Poor 7.9% |
| Immigrants | Ecuador | 14.9 /100 | #211 | Poor 7.9% |
| Swiss | 12.3 /100 | #212 | Poor 7.9% |
| Scottish | 11.4 /100 | #213 | Poor 7.9% |
| Spanish | 11.3 /100 | #214 | Poor 7.9% |
| Ecuadorians | 11.2 /100 | #215 | Poor 7.9% |
Demographics Similar to Immigrants from Russia by Unemployment Among Women with Children Under 6 years
In terms of unemployment among women with children under 6 years, the demographic groups most similar to Immigrants from Russia are Hmong (6.7%, a difference of 0.060%), Sri Lankan (6.6%, a difference of 0.19%), Asian (6.7%, a difference of 0.22%), Immigrants from Indonesia (6.7%, a difference of 0.37%), and Luxembourger (6.6%, a difference of 0.45%).
| Demographics | Rating | Rank | Unemployment Among Women with Children Under 6 years |
| Tsimshian | 100.0 /100 | #32 | Exceptional 6.6% |
| Immigrants | Vietnam | 100.0 /100 | #33 | Exceptional 6.6% |
| Immigrants | South Central Asia | 100.0 /100 | #34 | Exceptional 6.6% |
| Yakama | 100.0 /100 | #35 | Exceptional 6.6% |
| Luxembourgers | 100.0 /100 | #36 | Exceptional 6.6% |
| Sri Lankans | 100.0 /100 | #37 | Exceptional 6.6% |
| Hmong | 100.0 /100 | #38 | Exceptional 6.7% |
| Immigrants | Russia | 100.0 /100 | #39 | Exceptional 6.7% |
| Asians | 100.0 /100 | #40 | Exceptional 6.7% |
| Immigrants | Indonesia | 99.9 /100 | #41 | Exceptional 6.7% |
| Immigrants | Cuba | 99.9 /100 | #42 | Exceptional 6.7% |
| Bhutanese | 99.9 /100 | #43 | Exceptional 6.7% |
| Iranians | 99.9 /100 | #44 | Exceptional 6.7% |
| Immigrants | Australia | 99.9 /100 | #45 | Exceptional 6.8% |
| Latvians | 99.9 /100 | #46 | Exceptional 6.8% |