Immigrants from Syria vs Comanche Unemployment Among Women with Children Under 6 years
COMPARE
Immigrants from Syria
Comanche
Unemployment Among Women with Children Under 6 years
Unemployment Among Women with Children Under 6 years Comparison
Immigrants from Syria
Comanche
7.8%
UNEMPLOYMENT AMONG WOMEN WITH CHILDREN UNDER 6 YEARS
18.9/ 100
METRIC RATING
208th/ 347
METRIC RANK
8.0%
UNEMPLOYMENT AMONG WOMEN WITH CHILDREN UNDER 6 YEARS
4.3/ 100
METRIC RATING
235th/ 347
METRIC RANK
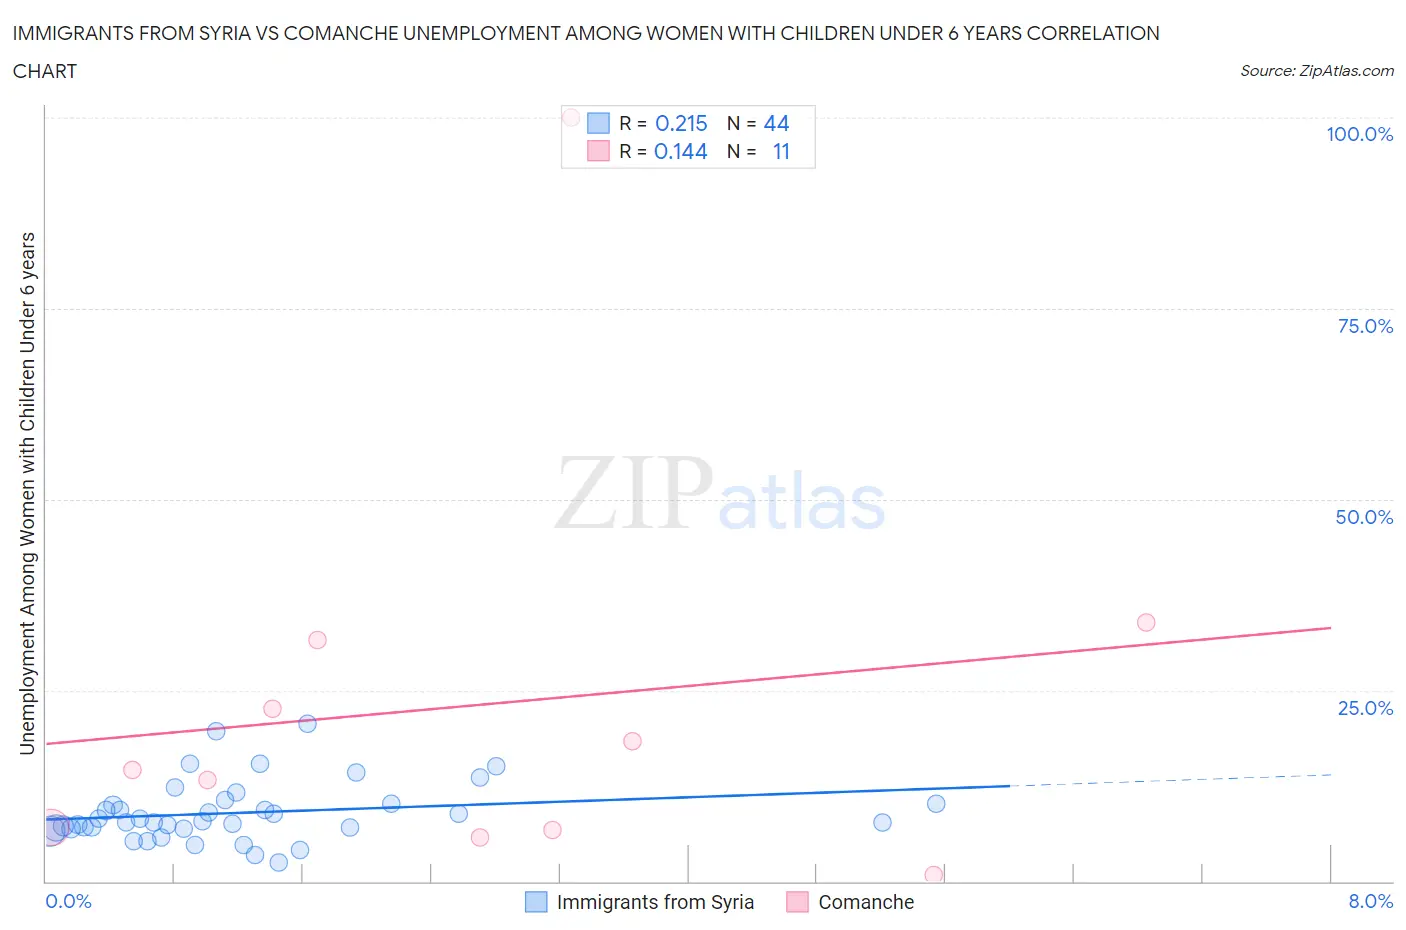
Immigrants from Syria vs Comanche Unemployment Among Women with Children Under 6 years Correlation Chart
The statistical analysis conducted on geographies consisting of 150,011,263 people shows a weak positive correlation between the proportion of Immigrants from Syria and unemployment rate among women with children under the age of 6 in the United States with a correlation coefficient (R) of 0.215 and weighted average of 7.8%. Similarly, the statistical analysis conducted on geographies consisting of 96,385,597 people shows a poor positive correlation between the proportion of Comanche and unemployment rate among women with children under the age of 6 in the United States with a correlation coefficient (R) of 0.144 and weighted average of 8.0%, a difference of 2.7%.
Unemployment Among Women with Children Under 6 years Correlation Summary
| Measurement | Immigrants from Syria | Comanche |
| Minimum | 2.5% | 0.90% |
| Maximum | 20.7% | 100.0% |
| Range | 18.2% | 99.1% |
| Mean | 9.0% | 23.1% |
| Median | 7.8% | 14.6% |
| Interquartile 25% (IQ1) | 6.9% | 6.7% |
| Interquartile 75% (IQ3) | 10.2% | 31.6% |
| Interquartile Range (IQR) | 3.3% | 24.9% |
| Standard Deviation (Sample) | 3.9% | 27.6% |
| Standard Deviation (Population) | 3.9% | 26.3% |
Similar Demographics by Unemployment Among Women with Children Under 6 years
Demographics Similar to Immigrants from Syria by Unemployment Among Women with Children Under 6 years
In terms of unemployment among women with children under 6 years, the demographic groups most similar to Immigrants from Syria are Costa Rican (7.8%, a difference of 0.14%), Canadian (7.8%, a difference of 0.18%), Hungarian (7.8%, a difference of 0.23%), Immigrants (7.8%, a difference of 0.25%), and Polish (7.9%, a difference of 0.32%).
| Demographics | Rating | Rank | Unemployment Among Women with Children Under 6 years |
| Basques | 24.7 /100 | #201 | Fair 7.8% |
| Sudanese | 23.5 /100 | #202 | Fair 7.8% |
| Spaniards | 23.3 /100 | #203 | Fair 7.8% |
| Lebanese | 22.2 /100 | #204 | Fair 7.8% |
| Immigrants | Immigrants | 21.4 /100 | #205 | Fair 7.8% |
| Hungarians | 21.2 /100 | #206 | Fair 7.8% |
| Canadians | 20.6 /100 | #207 | Fair 7.8% |
| Immigrants | Syria | 18.9 /100 | #208 | Poor 7.8% |
| Costa Ricans | 17.6 /100 | #209 | Poor 7.8% |
| Poles | 16.0 /100 | #210 | Poor 7.9% |
| Immigrants | Ecuador | 14.9 /100 | #211 | Poor 7.9% |
| Swiss | 12.3 /100 | #212 | Poor 7.9% |
| Scottish | 11.4 /100 | #213 | Poor 7.9% |
| Spanish | 11.3 /100 | #214 | Poor 7.9% |
| Ecuadorians | 11.2 /100 | #215 | Poor 7.9% |
Demographics Similar to Comanche by Unemployment Among Women with Children Under 6 years
In terms of unemployment among women with children under 6 years, the demographic groups most similar to Comanche are Immigrants from Barbados (8.0%, a difference of 0.020%), Kiowa (8.0%, a difference of 0.040%), Immigrants from Costa Rica (8.0%, a difference of 0.080%), Immigrants from Trinidad and Tobago (8.0%, a difference of 0.18%), and Welsh (8.0%, a difference of 0.27%).
| Demographics | Rating | Rank | Unemployment Among Women with Children Under 6 years |
| Immigrants | Sudan | 6.0 /100 | #228 | Tragic 8.0% |
| Salvadorans | 5.5 /100 | #229 | Tragic 8.0% |
| Finns | 5.3 /100 | #230 | Tragic 8.0% |
| Trinidadians and Tobagonians | 5.3 /100 | #231 | Tragic 8.0% |
| Welsh | 5.0 /100 | #232 | Tragic 8.0% |
| Immigrants | Trinidad and Tobago | 4.8 /100 | #233 | Tragic 8.0% |
| Kiowa | 4.4 /100 | #234 | Tragic 8.0% |
| Comanche | 4.3 /100 | #235 | Tragic 8.0% |
| Immigrants | Barbados | 4.2 /100 | #236 | Tragic 8.0% |
| Immigrants | Costa Rica | 4.1 /100 | #237 | Tragic 8.0% |
| Immigrants | Middle Africa | 3.2 /100 | #238 | Tragic 8.1% |
| Irish | 2.7 /100 | #239 | Tragic 8.1% |
| Immigrants | El Salvador | 2.6 /100 | #240 | Tragic 8.1% |
| Liberians | 2.6 /100 | #241 | Tragic 8.1% |
| Dutch | 2.5 /100 | #242 | Tragic 8.1% |