Immigrants from Syria vs Immigrants from Northern Europe Unemployment Among Women with Children Under 6 years
COMPARE
Immigrants from Syria
Immigrants from Northern Europe
Unemployment Among Women with Children Under 6 years
Unemployment Among Women with Children Under 6 years Comparison
Immigrants from Syria
Immigrants from Northern Europe
7.8%
UNEMPLOYMENT AMONG WOMEN WITH CHILDREN UNDER 6 YEARS
18.9/ 100
METRIC RATING
208th/ 347
METRIC RANK
7.2%
UNEMPLOYMENT AMONG WOMEN WITH CHILDREN UNDER 6 YEARS
97.4/ 100
METRIC RATING
100th/ 347
METRIC RANK
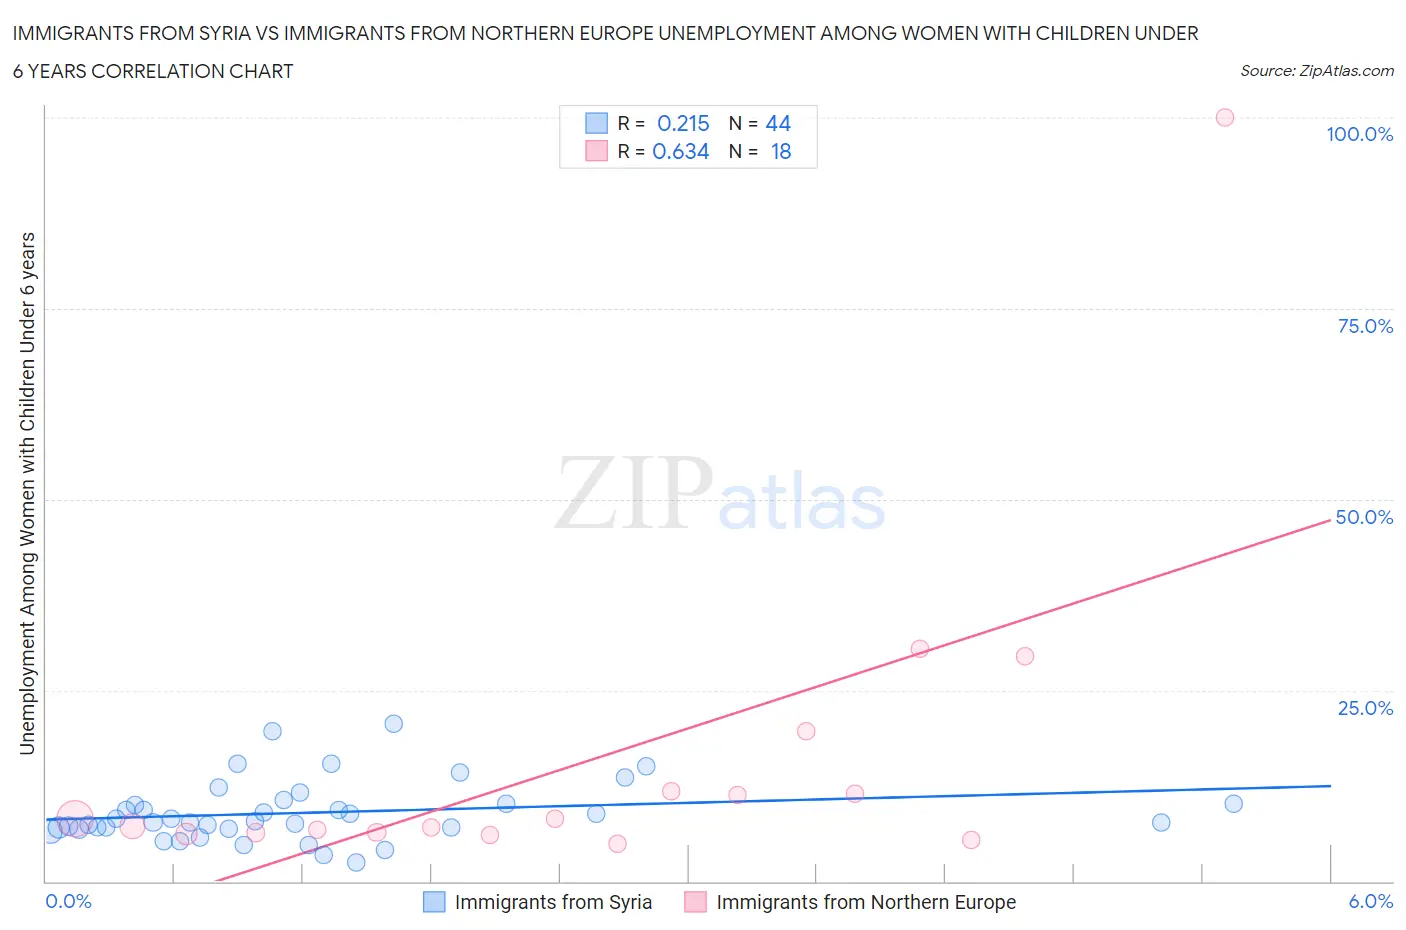
Immigrants from Syria vs Immigrants from Northern Europe Unemployment Among Women with Children Under 6 years Correlation Chart
The statistical analysis conducted on geographies consisting of 150,011,263 people shows a weak positive correlation between the proportion of Immigrants from Syria and unemployment rate among women with children under the age of 6 in the United States with a correlation coefficient (R) of 0.215 and weighted average of 7.8%. Similarly, the statistical analysis conducted on geographies consisting of 342,036,687 people shows a significant positive correlation between the proportion of Immigrants from Northern Europe and unemployment rate among women with children under the age of 6 in the United States with a correlation coefficient (R) of 0.634 and weighted average of 7.2%, a difference of 8.9%.
Unemployment Among Women with Children Under 6 years Correlation Summary
| Measurement | Immigrants from Syria | Immigrants from Northern Europe |
| Minimum | 2.5% | 4.9% |
| Maximum | 20.7% | 100.0% |
| Range | 18.2% | 95.1% |
| Mean | 9.0% | 15.9% |
| Median | 7.8% | 7.7% |
| Interquartile 25% (IQ1) | 6.9% | 6.4% |
| Interquartile 75% (IQ3) | 10.2% | 11.8% |
| Interquartile Range (IQR) | 3.3% | 5.4% |
| Standard Deviation (Sample) | 3.9% | 22.4% |
| Standard Deviation (Population) | 3.9% | 21.7% |
Similar Demographics by Unemployment Among Women with Children Under 6 years
Demographics Similar to Immigrants from Syria by Unemployment Among Women with Children Under 6 years
In terms of unemployment among women with children under 6 years, the demographic groups most similar to Immigrants from Syria are Costa Rican (7.8%, a difference of 0.14%), Canadian (7.8%, a difference of 0.18%), Hungarian (7.8%, a difference of 0.23%), Immigrants (7.8%, a difference of 0.25%), and Polish (7.9%, a difference of 0.32%).
| Demographics | Rating | Rank | Unemployment Among Women with Children Under 6 years |
| Basques | 24.7 /100 | #201 | Fair 7.8% |
| Sudanese | 23.5 /100 | #202 | Fair 7.8% |
| Spaniards | 23.3 /100 | #203 | Fair 7.8% |
| Lebanese | 22.2 /100 | #204 | Fair 7.8% |
| Immigrants | Immigrants | 21.4 /100 | #205 | Fair 7.8% |
| Hungarians | 21.2 /100 | #206 | Fair 7.8% |
| Canadians | 20.6 /100 | #207 | Fair 7.8% |
| Immigrants | Syria | 18.9 /100 | #208 | Poor 7.8% |
| Costa Ricans | 17.6 /100 | #209 | Poor 7.8% |
| Poles | 16.0 /100 | #210 | Poor 7.9% |
| Immigrants | Ecuador | 14.9 /100 | #211 | Poor 7.9% |
| Swiss | 12.3 /100 | #212 | Poor 7.9% |
| Scottish | 11.4 /100 | #213 | Poor 7.9% |
| Spanish | 11.3 /100 | #214 | Poor 7.9% |
| Ecuadorians | 11.2 /100 | #215 | Poor 7.9% |
Demographics Similar to Immigrants from Northern Europe by Unemployment Among Women with Children Under 6 years
In terms of unemployment among women with children under 6 years, the demographic groups most similar to Immigrants from Northern Europe are Chilean (7.2%, a difference of 0.020%), Immigrants from Europe (7.2%, a difference of 0.040%), Immigrants from Nicaragua (7.2%, a difference of 0.050%), Immigrants from Saudi Arabia (7.2%, a difference of 0.050%), and Russian (7.2%, a difference of 0.080%).
| Demographics | Rating | Rank | Unemployment Among Women with Children Under 6 years |
| New Zealanders | 97.8 /100 | #93 | Exceptional 7.2% |
| Macedonians | 97.7 /100 | #94 | Exceptional 7.2% |
| Romanians | 97.7 /100 | #95 | Exceptional 7.2% |
| Immigrants | Eastern Africa | 97.7 /100 | #96 | Exceptional 7.2% |
| Immigrants | South Eastern Asia | 97.6 /100 | #97 | Exceptional 7.2% |
| Russians | 97.5 /100 | #98 | Exceptional 7.2% |
| Immigrants | Europe | 97.5 /100 | #99 | Exceptional 7.2% |
| Immigrants | Northern Europe | 97.4 /100 | #100 | Exceptional 7.2% |
| Chileans | 97.4 /100 | #101 | Exceptional 7.2% |
| Immigrants | Nicaragua | 97.3 /100 | #102 | Exceptional 7.2% |
| Immigrants | Saudi Arabia | 97.3 /100 | #103 | Exceptional 7.2% |
| Immigrants | Egypt | 97.2 /100 | #104 | Exceptional 7.2% |
| Venezuelans | 97.2 /100 | #105 | Exceptional 7.2% |
| Immigrants | Pakistan | 97.2 /100 | #106 | Exceptional 7.2% |
| Immigrants | Kazakhstan | 97.1 /100 | #107 | Exceptional 7.2% |