Immigrants from Syria vs Immigrants from Russia Bachelor's Degree
COMPARE
Immigrants from Syria
Immigrants from Russia
Bachelor's Degree
Bachelor's Degree Comparison
Immigrants from Syria
Immigrants from Russia
40.5%
BACHELOR'S DEGREE
94.9/ 100
METRIC RATING
119th/ 347
METRIC RANK
45.4%
BACHELOR'S DEGREE
100.0/ 100
METRIC RATING
35th/ 347
METRIC RANK
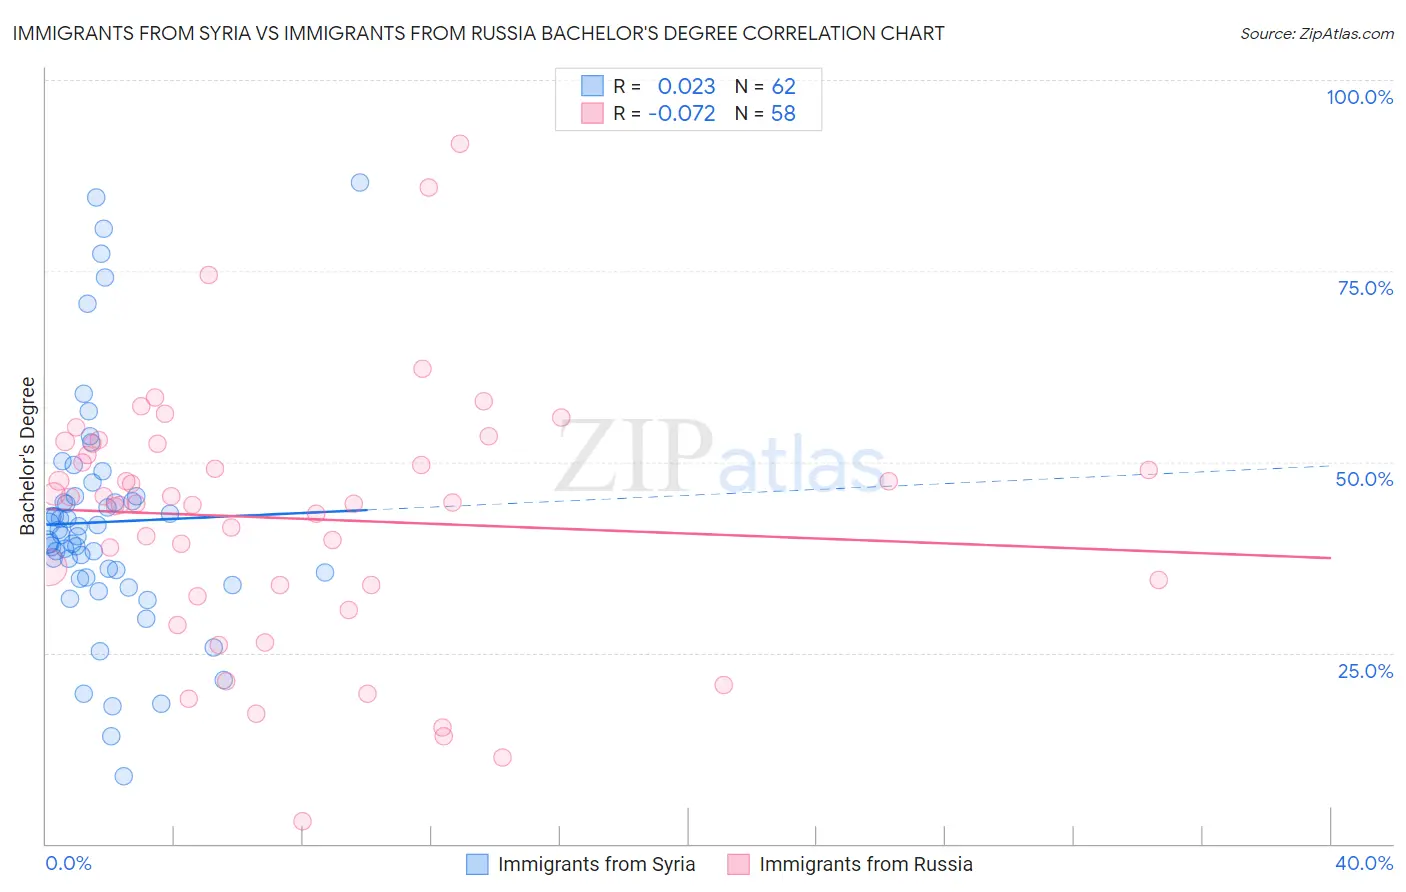
Immigrants from Syria vs Immigrants from Russia Bachelor's Degree Correlation Chart
The statistical analysis conducted on geographies consisting of 174,109,130 people shows no correlation between the proportion of Immigrants from Syria and percentage of population with at least bachelor's degree education in the United States with a correlation coefficient (R) of 0.023 and weighted average of 40.5%. Similarly, the statistical analysis conducted on geographies consisting of 347,903,485 people shows a slight negative correlation between the proportion of Immigrants from Russia and percentage of population with at least bachelor's degree education in the United States with a correlation coefficient (R) of -0.072 and weighted average of 45.4%, a difference of 12.1%.
Bachelor's Degree Correlation Summary
| Measurement | Immigrants from Syria | Immigrants from Russia |
| Minimum | 8.8% | 2.9% |
| Maximum | 86.6% | 91.7% |
| Range | 77.8% | 88.8% |
| Mean | 42.1% | 42.6% |
| Median | 40.3% | 44.6% |
| Interquartile 25% (IQ1) | 34.9% | 33.9% |
| Interquartile 75% (IQ3) | 45.5% | 52.3% |
| Interquartile Range (IQR) | 10.5% | 18.5% |
| Standard Deviation (Sample) | 15.6% | 16.7% |
| Standard Deviation (Population) | 15.5% | 16.5% |
Similar Demographics by Bachelor's Degree
Demographics Similar to Immigrants from Syria by Bachelor's Degree
In terms of bachelor's degree, the demographic groups most similar to Immigrants from Syria are Venezuelan (40.5%, a difference of 0.070%), Moroccan (40.5%, a difference of 0.12%), Immigrants from Albania (40.4%, a difference of 0.22%), Lebanese (40.4%, a difference of 0.24%), and Immigrants from Eritrea (40.4%, a difference of 0.24%).
| Demographics | Rating | Rank | Bachelor's Degree |
| Ugandans | 96.3 /100 | #112 | Exceptional 40.8% |
| Brazilians | 96.3 /100 | #113 | Exceptional 40.8% |
| Afghans | 96.2 /100 | #114 | Exceptional 40.8% |
| Palestinians | 95.8 /100 | #115 | Exceptional 40.7% |
| Immigrants | Uganda | 95.7 /100 | #116 | Exceptional 40.7% |
| Austrians | 95.5 /100 | #117 | Exceptional 40.6% |
| Croatians | 95.5 /100 | #118 | Exceptional 40.6% |
| Immigrants | Syria | 94.9 /100 | #119 | Exceptional 40.5% |
| Venezuelans | 94.7 /100 | #120 | Exceptional 40.5% |
| Moroccans | 94.6 /100 | #121 | Exceptional 40.5% |
| Immigrants | Albania | 94.4 /100 | #122 | Exceptional 40.4% |
| Lebanese | 94.3 /100 | #123 | Exceptional 40.4% |
| Immigrants | Eritrea | 94.3 /100 | #124 | Exceptional 40.4% |
| British | 94.2 /100 | #125 | Exceptional 40.4% |
| Immigrants | Eastern Africa | 94.1 /100 | #126 | Exceptional 40.4% |
Demographics Similar to Immigrants from Russia by Bachelor's Degree
In terms of bachelor's degree, the demographic groups most similar to Immigrants from Russia are Mongolian (45.4%, a difference of 0.020%), Immigrants from Denmark (45.4%, a difference of 0.030%), Russian (45.3%, a difference of 0.17%), Bulgarian (45.3%, a difference of 0.26%), and Immigrants from Northern Europe (45.6%, a difference of 0.48%).
| Demographics | Rating | Rank | Bachelor's Degree |
| Turks | 100.0 /100 | #28 | Exceptional 46.2% |
| Israelis | 100.0 /100 | #29 | Exceptional 46.1% |
| Immigrants | Sri Lanka | 100.0 /100 | #30 | Exceptional 46.1% |
| Latvians | 100.0 /100 | #31 | Exceptional 46.1% |
| Immigrants | Turkey | 100.0 /100 | #32 | Exceptional 46.0% |
| Immigrants | Northern Europe | 100.0 /100 | #33 | Exceptional 45.6% |
| Immigrants | Denmark | 100.0 /100 | #34 | Exceptional 45.4% |
| Immigrants | Russia | 100.0 /100 | #35 | Exceptional 45.4% |
| Mongolians | 100.0 /100 | #36 | Exceptional 45.4% |
| Russians | 100.0 /100 | #37 | Exceptional 45.3% |
| Bulgarians | 100.0 /100 | #38 | Exceptional 45.3% |
| Immigrants | Latvia | 100.0 /100 | #39 | Exceptional 45.1% |
| Immigrants | Belarus | 100.0 /100 | #40 | Exceptional 45.0% |
| Immigrants | Malaysia | 100.0 /100 | #41 | Exceptional 45.0% |
| Immigrants | Saudi Arabia | 100.0 /100 | #42 | Exceptional 44.8% |