Immigrants from Honduras vs Immigrants from Russia Unemployment Among Women with Children Under 6 years
COMPARE
Immigrants from Honduras
Immigrants from Russia
Unemployment Among Women with Children Under 6 years
Unemployment Among Women with Children Under 6 years Comparison
Immigrants from Honduras
Immigrants from Russia
8.4%
UNEMPLOYMENT AMONG WOMEN WITH CHILDREN UNDER 6 YEARS
0.3/ 100
METRIC RATING
266th/ 347
METRIC RANK
6.7%
UNEMPLOYMENT AMONG WOMEN WITH CHILDREN UNDER 6 YEARS
100.0/ 100
METRIC RATING
39th/ 347
METRIC RANK
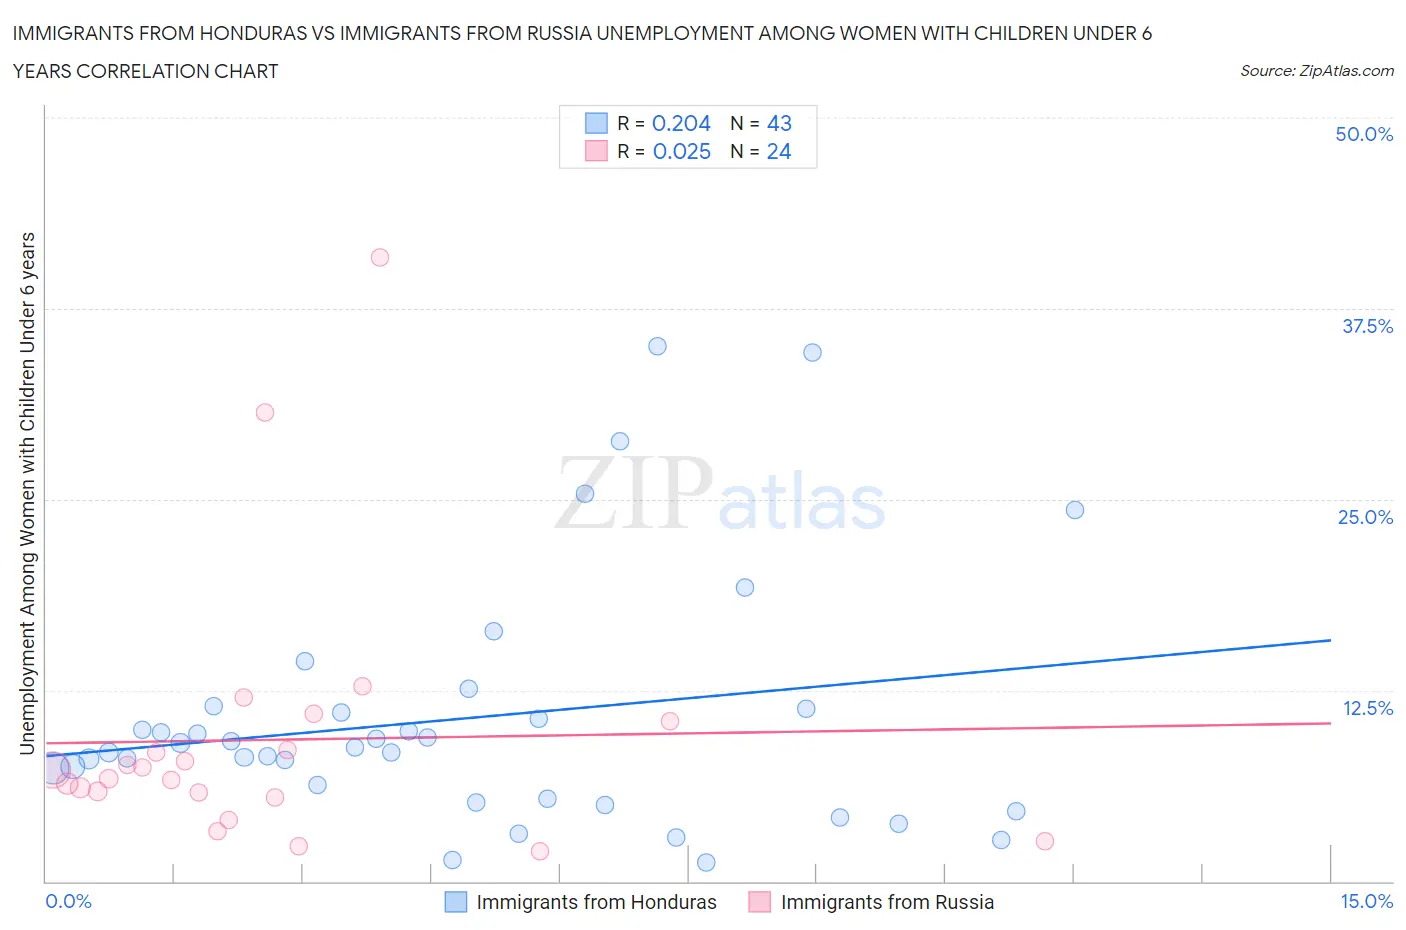
Immigrants from Honduras vs Immigrants from Russia Unemployment Among Women with Children Under 6 years Correlation Chart
The statistical analysis conducted on geographies consisting of 261,485,985 people shows a weak positive correlation between the proportion of Immigrants from Honduras and unemployment rate among women with children under the age of 6 in the United States with a correlation coefficient (R) of 0.204 and weighted average of 8.4%. Similarly, the statistical analysis conducted on geographies consisting of 268,851,554 people shows no correlation between the proportion of Immigrants from Russia and unemployment rate among women with children under the age of 6 in the United States with a correlation coefficient (R) of 0.025 and weighted average of 6.7%, a difference of 26.1%.
Unemployment Among Women with Children Under 6 years Correlation Summary
| Measurement | Immigrants from Honduras | Immigrants from Russia |
| Minimum | 1.2% | 2.0% |
| Maximum | 35.0% | 40.8% |
| Range | 33.8% | 38.8% |
| Mean | 10.6% | 9.3% |
| Median | 8.8% | 7.0% |
| Interquartile 25% (IQ1) | 5.4% | 5.7% |
| Interquartile 75% (IQ3) | 11.3% | 9.5% |
| Interquartile Range (IQR) | 5.9% | 3.9% |
| Standard Deviation (Sample) | 8.0% | 8.8% |
| Standard Deviation (Population) | 7.9% | 8.6% |
Similar Demographics by Unemployment Among Women with Children Under 6 years
Demographics Similar to Immigrants from Honduras by Unemployment Among Women with Children Under 6 years
In terms of unemployment among women with children under 6 years, the demographic groups most similar to Immigrants from Honduras are French Canadian (8.4%, a difference of 0.0%), Honduran (8.4%, a difference of 0.050%), Scotch-Irish (8.4%, a difference of 0.070%), West Indian (8.4%, a difference of 0.11%), and Immigrants from Liberia (8.4%, a difference of 0.12%).
| Demographics | Rating | Rank | Unemployment Among Women with Children Under 6 years |
| Barbadians | 0.4 /100 | #259 | Tragic 8.3% |
| Whites/Caucasians | 0.3 /100 | #260 | Tragic 8.4% |
| Immigrants | Liberia | 0.3 /100 | #261 | Tragic 8.4% |
| West Indians | 0.3 /100 | #262 | Tragic 8.4% |
| Scotch-Irish | 0.3 /100 | #263 | Tragic 8.4% |
| Hondurans | 0.3 /100 | #264 | Tragic 8.4% |
| French Canadians | 0.3 /100 | #265 | Tragic 8.4% |
| Immigrants | Honduras | 0.3 /100 | #266 | Tragic 8.4% |
| Belizeans | 0.2 /100 | #267 | Tragic 8.4% |
| Sub-Saharan Africans | 0.2 /100 | #268 | Tragic 8.4% |
| Immigrants | Haiti | 0.2 /100 | #269 | Tragic 8.4% |
| Immigrants | Senegal | 0.2 /100 | #270 | Tragic 8.5% |
| Immigrants | Congo | 0.2 /100 | #271 | Tragic 8.5% |
| Mexican American Indians | 0.1 /100 | #272 | Tragic 8.5% |
| Slovaks | 0.1 /100 | #273 | Tragic 8.5% |
Demographics Similar to Immigrants from Russia by Unemployment Among Women with Children Under 6 years
In terms of unemployment among women with children under 6 years, the demographic groups most similar to Immigrants from Russia are Hmong (6.7%, a difference of 0.060%), Sri Lankan (6.6%, a difference of 0.19%), Asian (6.7%, a difference of 0.22%), Immigrants from Indonesia (6.7%, a difference of 0.37%), and Luxembourger (6.6%, a difference of 0.45%).
| Demographics | Rating | Rank | Unemployment Among Women with Children Under 6 years |
| Tsimshian | 100.0 /100 | #32 | Exceptional 6.6% |
| Immigrants | Vietnam | 100.0 /100 | #33 | Exceptional 6.6% |
| Immigrants | South Central Asia | 100.0 /100 | #34 | Exceptional 6.6% |
| Yakama | 100.0 /100 | #35 | Exceptional 6.6% |
| Luxembourgers | 100.0 /100 | #36 | Exceptional 6.6% |
| Sri Lankans | 100.0 /100 | #37 | Exceptional 6.6% |
| Hmong | 100.0 /100 | #38 | Exceptional 6.7% |
| Immigrants | Russia | 100.0 /100 | #39 | Exceptional 6.7% |
| Asians | 100.0 /100 | #40 | Exceptional 6.7% |
| Immigrants | Indonesia | 99.9 /100 | #41 | Exceptional 6.7% |
| Immigrants | Cuba | 99.9 /100 | #42 | Exceptional 6.7% |
| Bhutanese | 99.9 /100 | #43 | Exceptional 6.7% |
| Iranians | 99.9 /100 | #44 | Exceptional 6.7% |
| Immigrants | Australia | 99.9 /100 | #45 | Exceptional 6.8% |
| Latvians | 99.9 /100 | #46 | Exceptional 6.8% |