Immigrants from Laos vs Immigrants from Russia Unemployment Among Women with Children Under 6 years
COMPARE
Immigrants from Laos
Immigrants from Russia
Unemployment Among Women with Children Under 6 years
Unemployment Among Women with Children Under 6 years Comparison
Immigrants from Laos
Immigrants from Russia
7.6%
UNEMPLOYMENT AMONG WOMEN WITH CHILDREN UNDER 6 YEARS
50.0/ 100
METRIC RATING
174th/ 347
METRIC RANK
6.7%
UNEMPLOYMENT AMONG WOMEN WITH CHILDREN UNDER 6 YEARS
100.0/ 100
METRIC RATING
39th/ 347
METRIC RANK
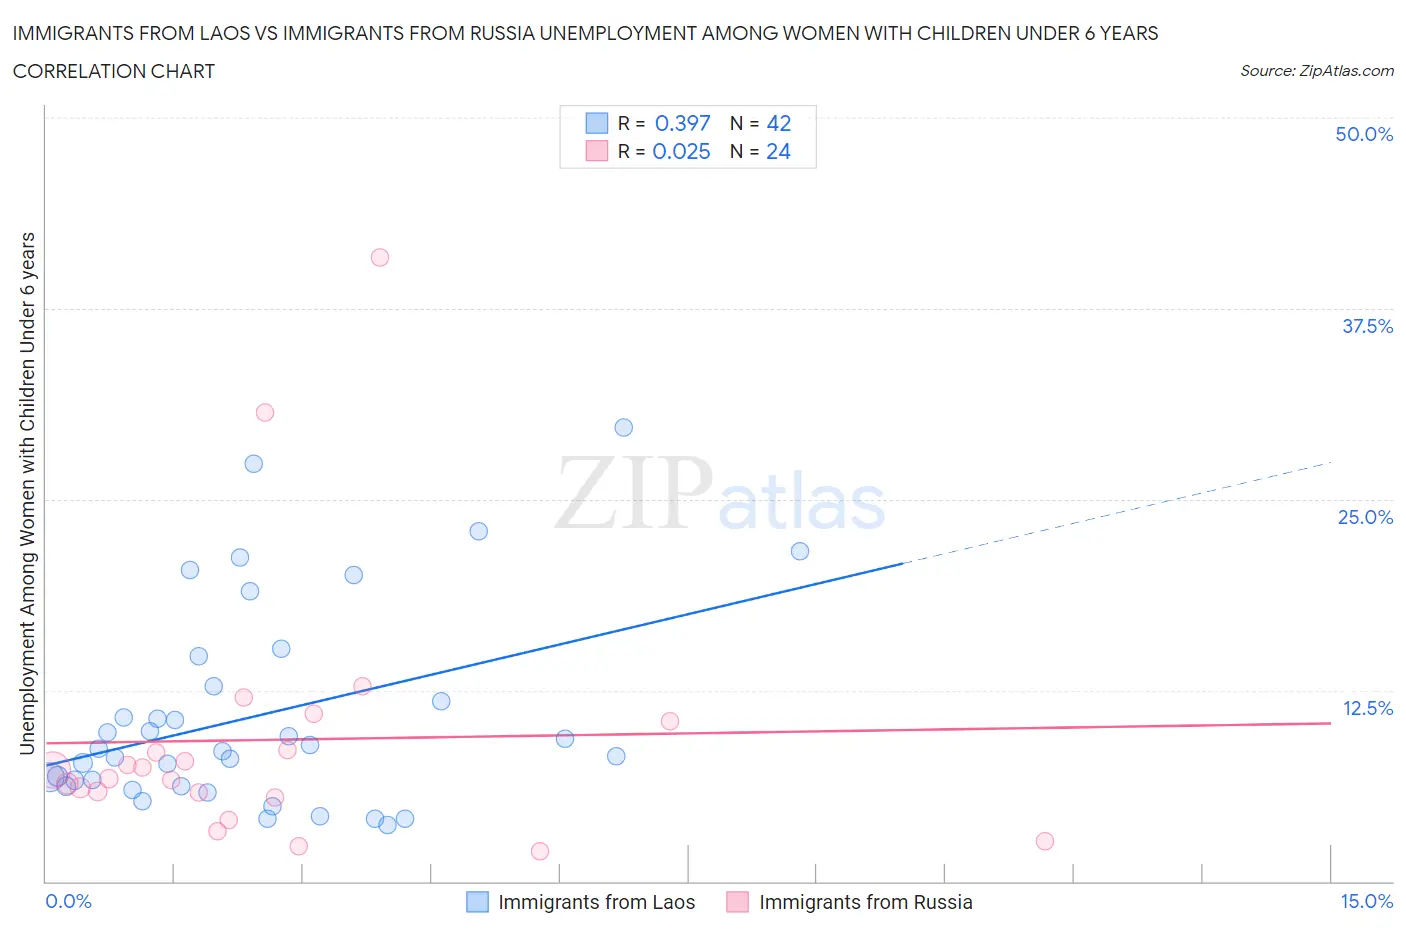
Immigrants from Laos vs Immigrants from Russia Unemployment Among Women with Children Under 6 years Correlation Chart
The statistical analysis conducted on geographies consisting of 170,684,767 people shows a mild positive correlation between the proportion of Immigrants from Laos and unemployment rate among women with children under the age of 6 in the United States with a correlation coefficient (R) of 0.397 and weighted average of 7.6%. Similarly, the statistical analysis conducted on geographies consisting of 268,851,554 people shows no correlation between the proportion of Immigrants from Russia and unemployment rate among women with children under the age of 6 in the United States with a correlation coefficient (R) of 0.025 and weighted average of 6.7%, a difference of 14.8%.
Unemployment Among Women with Children Under 6 years Correlation Summary
| Measurement | Immigrants from Laos | Immigrants from Russia |
| Minimum | 3.7% | 2.0% |
| Maximum | 29.7% | 40.8% |
| Range | 26.0% | 38.8% |
| Mean | 10.8% | 9.3% |
| Median | 8.6% | 7.0% |
| Interquartile 25% (IQ1) | 6.3% | 5.7% |
| Interquartile 75% (IQ3) | 12.8% | 9.5% |
| Interquartile Range (IQR) | 6.5% | 3.9% |
| Standard Deviation (Sample) | 6.6% | 8.8% |
| Standard Deviation (Population) | 6.5% | 8.6% |
Similar Demographics by Unemployment Among Women with Children Under 6 years
Demographics Similar to Immigrants from Laos by Unemployment Among Women with Children Under 6 years
In terms of unemployment among women with children under 6 years, the demographic groups most similar to Immigrants from Laos are Panamanian (7.6%, a difference of 0.020%), Cree (7.6%, a difference of 0.11%), Puget Sound Salish (7.7%, a difference of 0.15%), Austrian (7.7%, a difference of 0.27%), and Immigrants from England (7.7%, a difference of 0.31%).
| Demographics | Rating | Rank | Unemployment Among Women with Children Under 6 years |
| Kenyans | 62.5 /100 | #167 | Good 7.6% |
| Immigrants | Canada | 61.6 /100 | #168 | Good 7.6% |
| Immigrants | Scotland | 61.3 /100 | #169 | Good 7.6% |
| Czechs | 59.8 /100 | #170 | Average 7.6% |
| Immigrants | Grenada | 59.0 /100 | #171 | Average 7.6% |
| Immigrants | North America | 57.7 /100 | #172 | Average 7.6% |
| Cree | 51.6 /100 | #173 | Average 7.6% |
| Immigrants | Laos | 50.0 /100 | #174 | Average 7.6% |
| Panamanians | 49.6 /100 | #175 | Average 7.6% |
| Puget Sound Salish | 47.7 /100 | #176 | Average 7.7% |
| Austrians | 46.0 /100 | #177 | Average 7.7% |
| Immigrants | England | 45.4 /100 | #178 | Average 7.7% |
| Immigrants | Western Europe | 44.9 /100 | #179 | Average 7.7% |
| Immigrants | Uruguay | 44.5 /100 | #180 | Average 7.7% |
| Brazilians | 43.9 /100 | #181 | Average 7.7% |
Demographics Similar to Immigrants from Russia by Unemployment Among Women with Children Under 6 years
In terms of unemployment among women with children under 6 years, the demographic groups most similar to Immigrants from Russia are Hmong (6.7%, a difference of 0.060%), Sri Lankan (6.6%, a difference of 0.19%), Asian (6.7%, a difference of 0.22%), Immigrants from Indonesia (6.7%, a difference of 0.37%), and Luxembourger (6.6%, a difference of 0.45%).
| Demographics | Rating | Rank | Unemployment Among Women with Children Under 6 years |
| Tsimshian | 100.0 /100 | #32 | Exceptional 6.6% |
| Immigrants | Vietnam | 100.0 /100 | #33 | Exceptional 6.6% |
| Immigrants | South Central Asia | 100.0 /100 | #34 | Exceptional 6.6% |
| Yakama | 100.0 /100 | #35 | Exceptional 6.6% |
| Luxembourgers | 100.0 /100 | #36 | Exceptional 6.6% |
| Sri Lankans | 100.0 /100 | #37 | Exceptional 6.6% |
| Hmong | 100.0 /100 | #38 | Exceptional 6.7% |
| Immigrants | Russia | 100.0 /100 | #39 | Exceptional 6.7% |
| Asians | 100.0 /100 | #40 | Exceptional 6.7% |
| Immigrants | Indonesia | 99.9 /100 | #41 | Exceptional 6.7% |
| Immigrants | Cuba | 99.9 /100 | #42 | Exceptional 6.7% |
| Bhutanese | 99.9 /100 | #43 | Exceptional 6.7% |
| Iranians | 99.9 /100 | #44 | Exceptional 6.7% |
| Immigrants | Australia | 99.9 /100 | #45 | Exceptional 6.8% |
| Latvians | 99.9 /100 | #46 | Exceptional 6.8% |