Immigrants from Eritrea vs Bangladeshi Male Unemployment
COMPARE
Immigrants from Eritrea
Bangladeshi
Male Unemployment
Male Unemployment Comparison
Immigrants from Eritrea
Bangladeshis
5.0%
MALE UNEMPLOYMENT
96.0/ 100
METRIC RATING
83rd/ 347
METRIC RANK
5.7%
MALE UNEMPLOYMENT
0.8/ 100
METRIC RATING
243rd/ 347
METRIC RANK
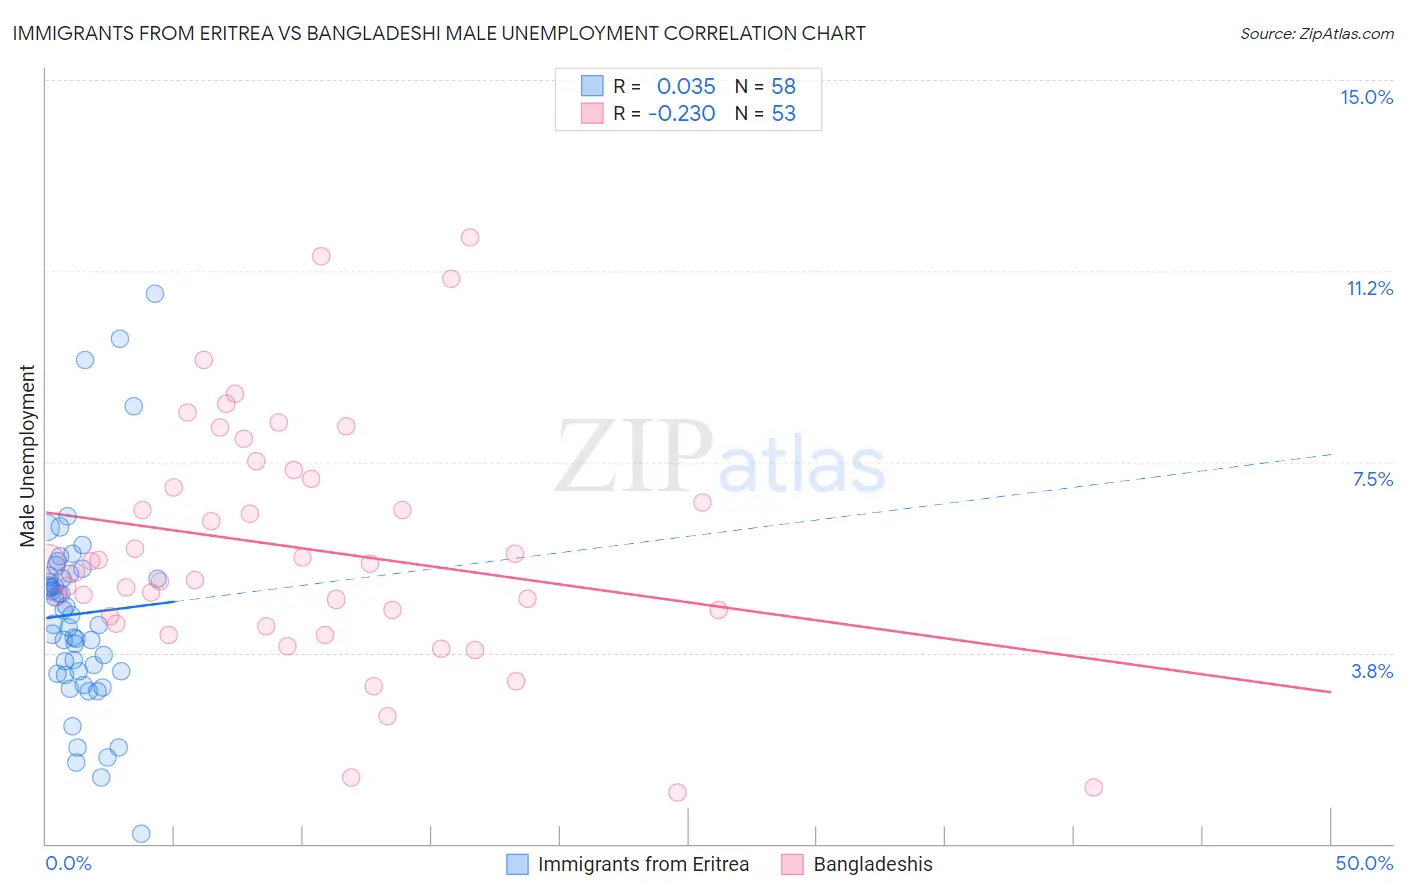
Immigrants from Eritrea vs Bangladeshi Male Unemployment Correlation Chart
The statistical analysis conducted on geographies consisting of 104,807,981 people shows no correlation between the proportion of Immigrants from Eritrea and unemployment rate among males in the United States with a correlation coefficient (R) of 0.035 and weighted average of 5.0%. Similarly, the statistical analysis conducted on geographies consisting of 141,111,800 people shows a weak negative correlation between the proportion of Bangladeshis and unemployment rate among males in the United States with a correlation coefficient (R) of -0.230 and weighted average of 5.7%, a difference of 12.3%.
Male Unemployment Correlation Summary
| Measurement | Immigrants from Eritrea | Bangladeshi |
| Minimum | 0.20% | 1.0% |
| Maximum | 10.8% | 11.9% |
| Range | 10.6% | 10.9% |
| Mean | 4.5% | 5.8% |
| Median | 4.4% | 5.5% |
| Interquartile 25% (IQ1) | 3.4% | 4.4% |
| Interquartile 75% (IQ3) | 5.3% | 7.3% |
| Interquartile Range (IQR) | 1.9% | 2.9% |
| Standard Deviation (Sample) | 1.9% | 2.4% |
| Standard Deviation (Population) | 1.9% | 2.4% |
Similar Demographics by Male Unemployment
Demographics Similar to Immigrants from Eritrea by Male Unemployment
In terms of male unemployment, the demographic groups most similar to Immigrants from Eritrea are Chilean (5.0%, a difference of 0.060%), Argentinean (5.0%, a difference of 0.090%), French (5.0%, a difference of 0.090%), Serbian (5.1%, a difference of 0.12%), and South African (5.0%, a difference of 0.14%).
| Demographics | Rating | Rank | Male Unemployment |
| Immigrants | Sudan | 96.5 /100 | #76 | Exceptional 5.0% |
| Iranians | 96.4 /100 | #77 | Exceptional 5.0% |
| Immigrants | Northern Europe | 96.4 /100 | #78 | Exceptional 5.0% |
| South Africans | 96.4 /100 | #79 | Exceptional 5.0% |
| Argentineans | 96.2 /100 | #80 | Exceptional 5.0% |
| French | 96.2 /100 | #81 | Exceptional 5.0% |
| Chileans | 96.2 /100 | #82 | Exceptional 5.0% |
| Immigrants | Eritrea | 96.0 /100 | #83 | Exceptional 5.0% |
| Serbians | 95.7 /100 | #84 | Exceptional 5.1% |
| Immigrants | North Macedonia | 95.6 /100 | #85 | Exceptional 5.1% |
| Maltese | 95.5 /100 | #86 | Exceptional 5.1% |
| Immigrants | Romania | 95.4 /100 | #87 | Exceptional 5.1% |
| Immigrants | Sri Lanka | 94.9 /100 | #88 | Exceptional 5.1% |
| Immigrants | Australia | 94.7 /100 | #89 | Exceptional 5.1% |
| Okinawans | 94.7 /100 | #90 | Exceptional 5.1% |
Demographics Similar to Bangladeshis by Male Unemployment
In terms of male unemployment, the demographic groups most similar to Bangladeshis are Immigrants from El Salvador (5.7%, a difference of 0.050%), Yaqui (5.7%, a difference of 0.21%), Ottawa (5.7%, a difference of 0.28%), Iroquois (5.7%, a difference of 0.30%), and Salvadoran (5.7%, a difference of 0.35%).
| Demographics | Rating | Rank | Male Unemployment |
| Guatemalans | 1.2 /100 | #236 | Tragic 5.6% |
| Hondurans | 1.1 /100 | #237 | Tragic 5.6% |
| Native Hawaiians | 1.1 /100 | #238 | Tragic 5.6% |
| Immigrants | Guatemala | 1.1 /100 | #239 | Tragic 5.6% |
| Immigrants | Cameroon | 1.0 /100 | #240 | Tragic 5.6% |
| Salvadorans | 1.0 /100 | #241 | Tragic 5.7% |
| Ottawa | 0.9 /100 | #242 | Tragic 5.7% |
| Bangladeshis | 0.8 /100 | #243 | Tragic 5.7% |
| Immigrants | El Salvador | 0.7 /100 | #244 | Tragic 5.7% |
| Yaqui | 0.7 /100 | #245 | Tragic 5.7% |
| Iroquois | 0.6 /100 | #246 | Tragic 5.7% |
| Hawaiians | 0.6 /100 | #247 | Tragic 5.7% |
| Marshallese | 0.5 /100 | #248 | Tragic 5.7% |
| Cree | 0.4 /100 | #249 | Tragic 5.7% |
| Immigrants | Bahamas | 0.4 /100 | #250 | Tragic 5.7% |