Immigrants from Belize vs Bangladeshi Male Unemployment
COMPARE
Immigrants from Belize
Bangladeshi
Male Unemployment
Male Unemployment Comparison
Immigrants from Belize
Bangladeshis
6.6%
MALE UNEMPLOYMENT
0.0/ 100
METRIC RATING
301st/ 347
METRIC RANK
5.7%
MALE UNEMPLOYMENT
0.8/ 100
METRIC RATING
243rd/ 347
METRIC RANK
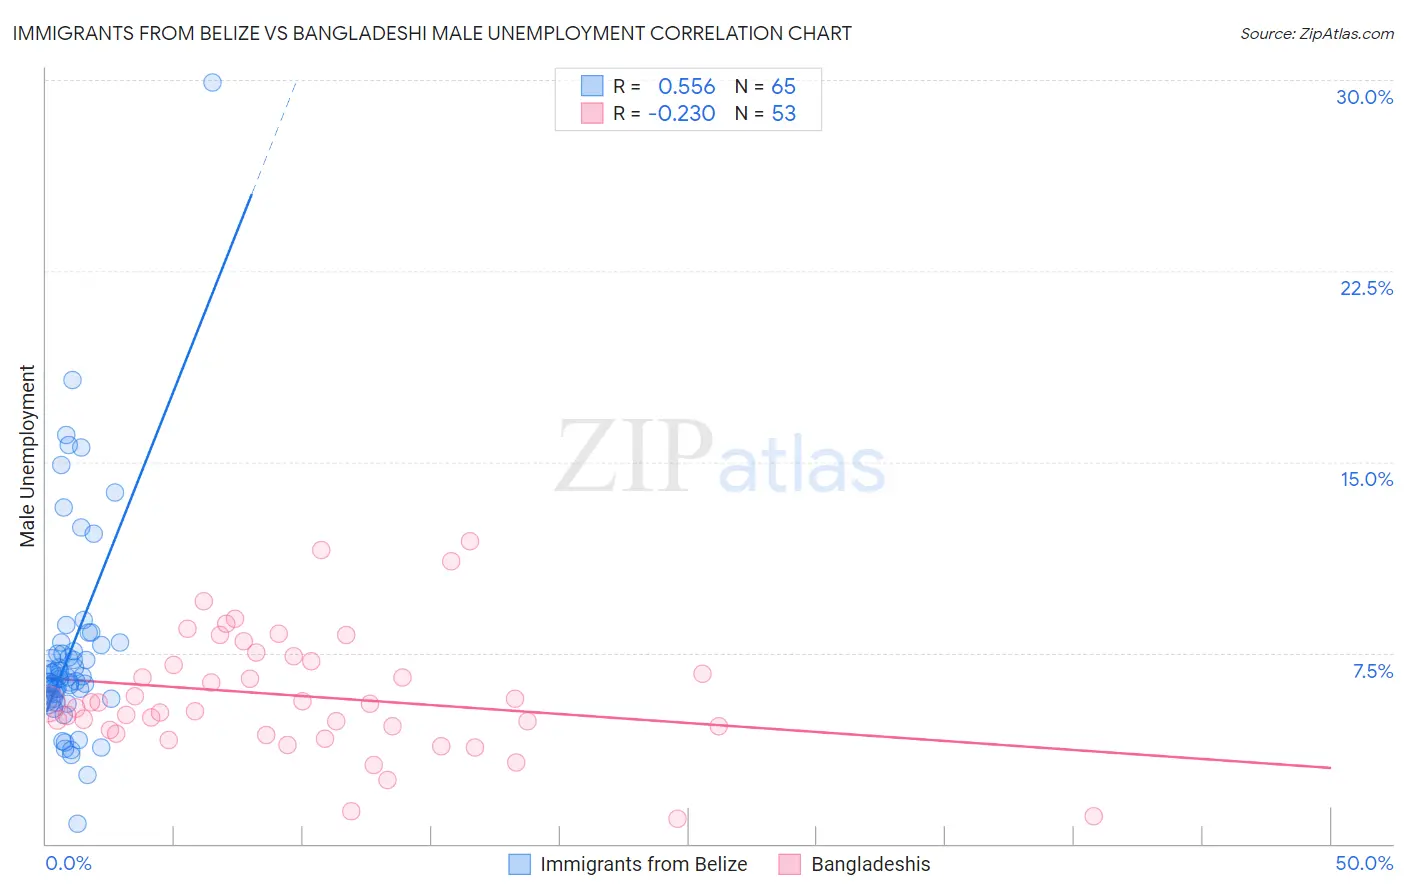
Immigrants from Belize vs Bangladeshi Male Unemployment Correlation Chart
The statistical analysis conducted on geographies consisting of 130,217,625 people shows a substantial positive correlation between the proportion of Immigrants from Belize and unemployment rate among males in the United States with a correlation coefficient (R) of 0.556 and weighted average of 6.6%. Similarly, the statistical analysis conducted on geographies consisting of 141,111,800 people shows a weak negative correlation between the proportion of Bangladeshis and unemployment rate among males in the United States with a correlation coefficient (R) of -0.230 and weighted average of 5.7%, a difference of 16.2%.
Male Unemployment Correlation Summary
| Measurement | Immigrants from Belize | Bangladeshi |
| Minimum | 0.80% | 1.0% |
| Maximum | 29.9% | 11.9% |
| Range | 29.1% | 10.9% |
| Mean | 7.7% | 5.8% |
| Median | 6.5% | 5.5% |
| Interquartile 25% (IQ1) | 5.7% | 4.4% |
| Interquartile 75% (IQ3) | 7.9% | 7.3% |
| Interquartile Range (IQR) | 2.1% | 2.9% |
| Standard Deviation (Sample) | 4.4% | 2.4% |
| Standard Deviation (Population) | 4.3% | 2.4% |
Similar Demographics by Male Unemployment
Demographics Similar to Immigrants from Belize by Male Unemployment
In terms of male unemployment, the demographic groups most similar to Immigrants from Belize are Vietnamese (6.6%, a difference of 0.11%), Immigrants from Bangladesh (6.6%, a difference of 0.38%), Jamaican (6.6%, a difference of 0.51%), Chippewa (6.6%, a difference of 0.58%), and Ute (6.6%, a difference of 0.71%).
| Demographics | Rating | Rank | Male Unemployment |
| Senegalese | 0.0 /100 | #294 | Tragic 6.4% |
| Belizeans | 0.0 /100 | #295 | Tragic 6.5% |
| Immigrants | Haiti | 0.0 /100 | #296 | Tragic 6.5% |
| Chippewa | 0.0 /100 | #297 | Tragic 6.6% |
| Jamaicans | 0.0 /100 | #298 | Tragic 6.6% |
| Immigrants | Bangladesh | 0.0 /100 | #299 | Tragic 6.6% |
| Vietnamese | 0.0 /100 | #300 | Tragic 6.6% |
| Immigrants | Belize | 0.0 /100 | #301 | Tragic 6.6% |
| Ute | 0.0 /100 | #302 | Tragic 6.6% |
| Immigrants | West Indies | 0.0 /100 | #303 | Tragic 6.7% |
| West Indians | 0.0 /100 | #304 | Tragic 6.7% |
| Trinidadians and Tobagonians | 0.0 /100 | #305 | Tragic 6.7% |
| Immigrants | Trinidad and Tobago | 0.0 /100 | #306 | Tragic 6.7% |
| Immigrants | Jamaica | 0.0 /100 | #307 | Tragic 6.7% |
| Aleuts | 0.0 /100 | #308 | Tragic 6.8% |
Demographics Similar to Bangladeshis by Male Unemployment
In terms of male unemployment, the demographic groups most similar to Bangladeshis are Immigrants from El Salvador (5.7%, a difference of 0.050%), Yaqui (5.7%, a difference of 0.21%), Ottawa (5.7%, a difference of 0.28%), Iroquois (5.7%, a difference of 0.30%), and Salvadoran (5.7%, a difference of 0.35%).
| Demographics | Rating | Rank | Male Unemployment |
| Guatemalans | 1.2 /100 | #236 | Tragic 5.6% |
| Hondurans | 1.1 /100 | #237 | Tragic 5.6% |
| Native Hawaiians | 1.1 /100 | #238 | Tragic 5.6% |
| Immigrants | Guatemala | 1.1 /100 | #239 | Tragic 5.6% |
| Immigrants | Cameroon | 1.0 /100 | #240 | Tragic 5.6% |
| Salvadorans | 1.0 /100 | #241 | Tragic 5.7% |
| Ottawa | 0.9 /100 | #242 | Tragic 5.7% |
| Bangladeshis | 0.8 /100 | #243 | Tragic 5.7% |
| Immigrants | El Salvador | 0.7 /100 | #244 | Tragic 5.7% |
| Yaqui | 0.7 /100 | #245 | Tragic 5.7% |
| Iroquois | 0.6 /100 | #246 | Tragic 5.7% |
| Hawaiians | 0.6 /100 | #247 | Tragic 5.7% |
| Marshallese | 0.5 /100 | #248 | Tragic 5.7% |
| Cree | 0.4 /100 | #249 | Tragic 5.7% |
| Immigrants | Bahamas | 0.4 /100 | #250 | Tragic 5.7% |