Portuguese vs Bangladeshi Male Unemployment
COMPARE
Portuguese
Bangladeshi
Male Unemployment
Male Unemployment Comparison
Portuguese
Bangladeshis
5.6%
MALE UNEMPLOYMENT
3.5/ 100
METRIC RATING
220th/ 347
METRIC RANK
5.7%
MALE UNEMPLOYMENT
0.8/ 100
METRIC RATING
243rd/ 347
METRIC RANK
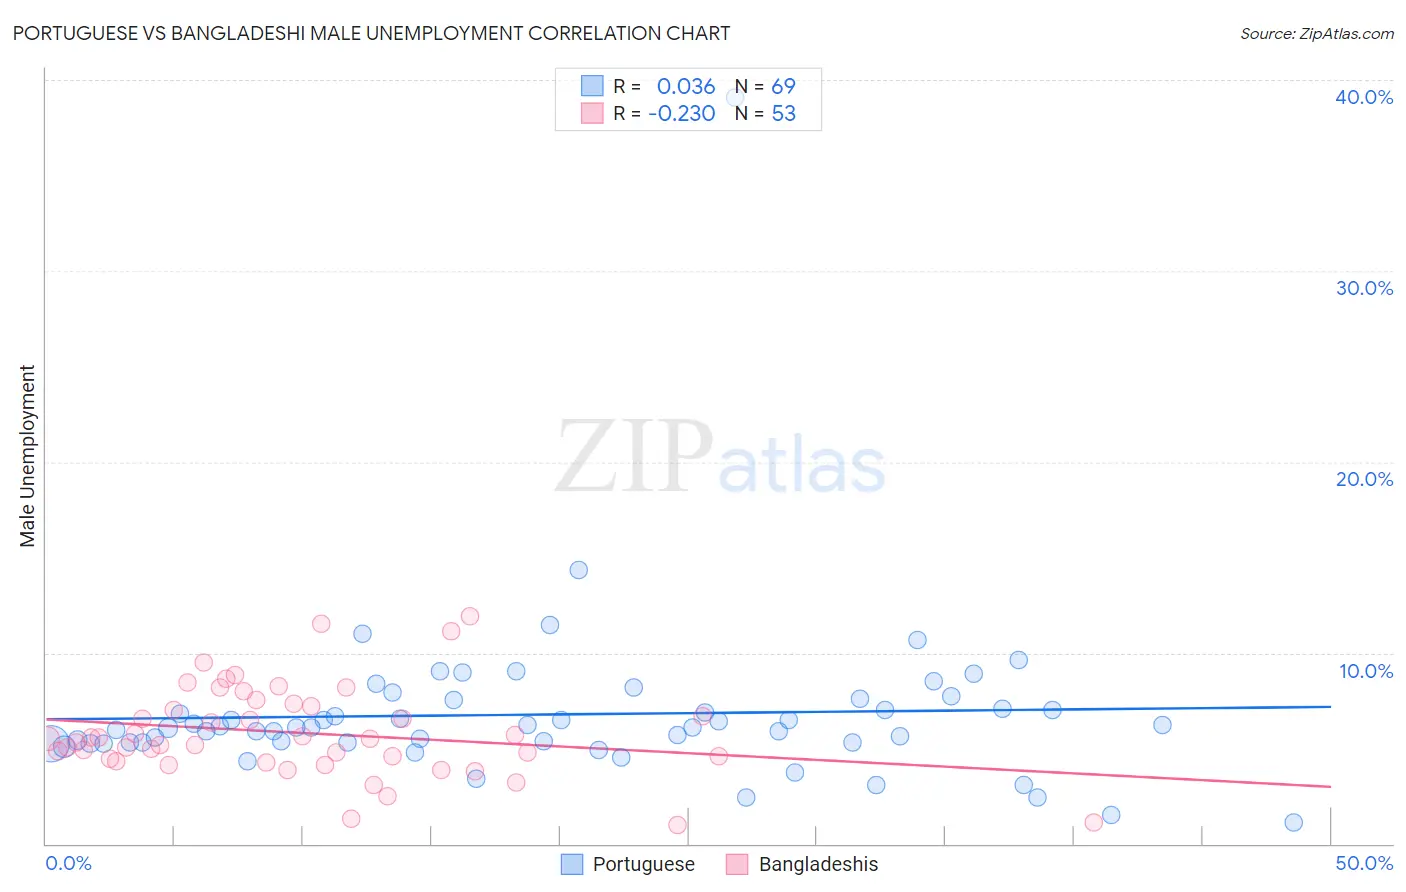
Portuguese vs Bangladeshi Male Unemployment Correlation Chart
The statistical analysis conducted on geographies consisting of 447,471,773 people shows no correlation between the proportion of Portuguese and unemployment rate among males in the United States with a correlation coefficient (R) of 0.036 and weighted average of 5.6%. Similarly, the statistical analysis conducted on geographies consisting of 141,111,800 people shows a weak negative correlation between the proportion of Bangladeshis and unemployment rate among males in the United States with a correlation coefficient (R) of -0.230 and weighted average of 5.7%, a difference of 2.1%.
Male Unemployment Correlation Summary
| Measurement | Portuguese | Bangladeshi |
| Minimum | 1.1% | 1.0% |
| Maximum | 39.1% | 11.9% |
| Range | 38.0% | 10.9% |
| Mean | 6.8% | 5.8% |
| Median | 6.1% | 5.5% |
| Interquartile 25% (IQ1) | 5.3% | 4.4% |
| Interquartile 75% (IQ3) | 7.3% | 7.3% |
| Interquartile Range (IQR) | 2.0% | 2.9% |
| Standard Deviation (Sample) | 4.5% | 2.4% |
| Standard Deviation (Population) | 4.5% | 2.4% |
Similar Demographics by Male Unemployment
Demographics Similar to Portuguese by Male Unemployment
In terms of male unemployment, the demographic groups most similar to Portuguese are Immigrants from Western Asia (5.6%, a difference of 0.030%), Immigrants from Albania (5.5%, a difference of 0.070%), Soviet Union (5.6%, a difference of 0.11%), Immigrants from Micronesia (5.6%, a difference of 0.25%), and Delaware (5.5%, a difference of 0.28%).
| Demographics | Rating | Rank | Male Unemployment |
| Ugandans | 6.3 /100 | #213 | Tragic 5.5% |
| Puget Sound Salish | 5.6 /100 | #214 | Tragic 5.5% |
| Samoans | 4.9 /100 | #215 | Tragic 5.5% |
| Immigrants | Immigrants | 4.3 /100 | #216 | Tragic 5.5% |
| Delaware | 4.2 /100 | #217 | Tragic 5.5% |
| Immigrants | Albania | 3.6 /100 | #218 | Tragic 5.5% |
| Immigrants | Western Asia | 3.5 /100 | #219 | Tragic 5.6% |
| Portuguese | 3.5 /100 | #220 | Tragic 5.6% |
| Soviet Union | 3.2 /100 | #221 | Tragic 5.6% |
| Immigrants | Micronesia | 2.9 /100 | #222 | Tragic 5.6% |
| Creek | 2.6 /100 | #223 | Tragic 5.6% |
| Cherokee | 2.4 /100 | #224 | Tragic 5.6% |
| Panamanians | 1.9 /100 | #225 | Tragic 5.6% |
| Immigrants | Cambodia | 1.8 /100 | #226 | Tragic 5.6% |
| Immigrants | Panama | 1.8 /100 | #227 | Tragic 5.6% |
Demographics Similar to Bangladeshis by Male Unemployment
In terms of male unemployment, the demographic groups most similar to Bangladeshis are Immigrants from El Salvador (5.7%, a difference of 0.050%), Yaqui (5.7%, a difference of 0.21%), Ottawa (5.7%, a difference of 0.28%), Iroquois (5.7%, a difference of 0.30%), and Salvadoran (5.7%, a difference of 0.35%).
| Demographics | Rating | Rank | Male Unemployment |
| Guatemalans | 1.2 /100 | #236 | Tragic 5.6% |
| Hondurans | 1.1 /100 | #237 | Tragic 5.6% |
| Native Hawaiians | 1.1 /100 | #238 | Tragic 5.6% |
| Immigrants | Guatemala | 1.1 /100 | #239 | Tragic 5.6% |
| Immigrants | Cameroon | 1.0 /100 | #240 | Tragic 5.6% |
| Salvadorans | 1.0 /100 | #241 | Tragic 5.7% |
| Ottawa | 0.9 /100 | #242 | Tragic 5.7% |
| Bangladeshis | 0.8 /100 | #243 | Tragic 5.7% |
| Immigrants | El Salvador | 0.7 /100 | #244 | Tragic 5.7% |
| Yaqui | 0.7 /100 | #245 | Tragic 5.7% |
| Iroquois | 0.6 /100 | #246 | Tragic 5.7% |
| Hawaiians | 0.6 /100 | #247 | Tragic 5.7% |
| Marshallese | 0.5 /100 | #248 | Tragic 5.7% |
| Cree | 0.4 /100 | #249 | Tragic 5.7% |
| Immigrants | Bahamas | 0.4 /100 | #250 | Tragic 5.7% |