Immigrants from Sierra Leone vs Immigrants from Lebanon Female Unemployment
COMPARE
Immigrants from Sierra Leone
Immigrants from Lebanon
Female Unemployment
Female Unemployment Comparison
Immigrants from Sierra Leone
Immigrants from Lebanon
5.7%
FEMALE UNEMPLOYMENT
0.6/ 100
METRIC RATING
253rd/ 347
METRIC RANK
5.5%
FEMALE UNEMPLOYMENT
3.3/ 100
METRIC RATING
234th/ 347
METRIC RANK
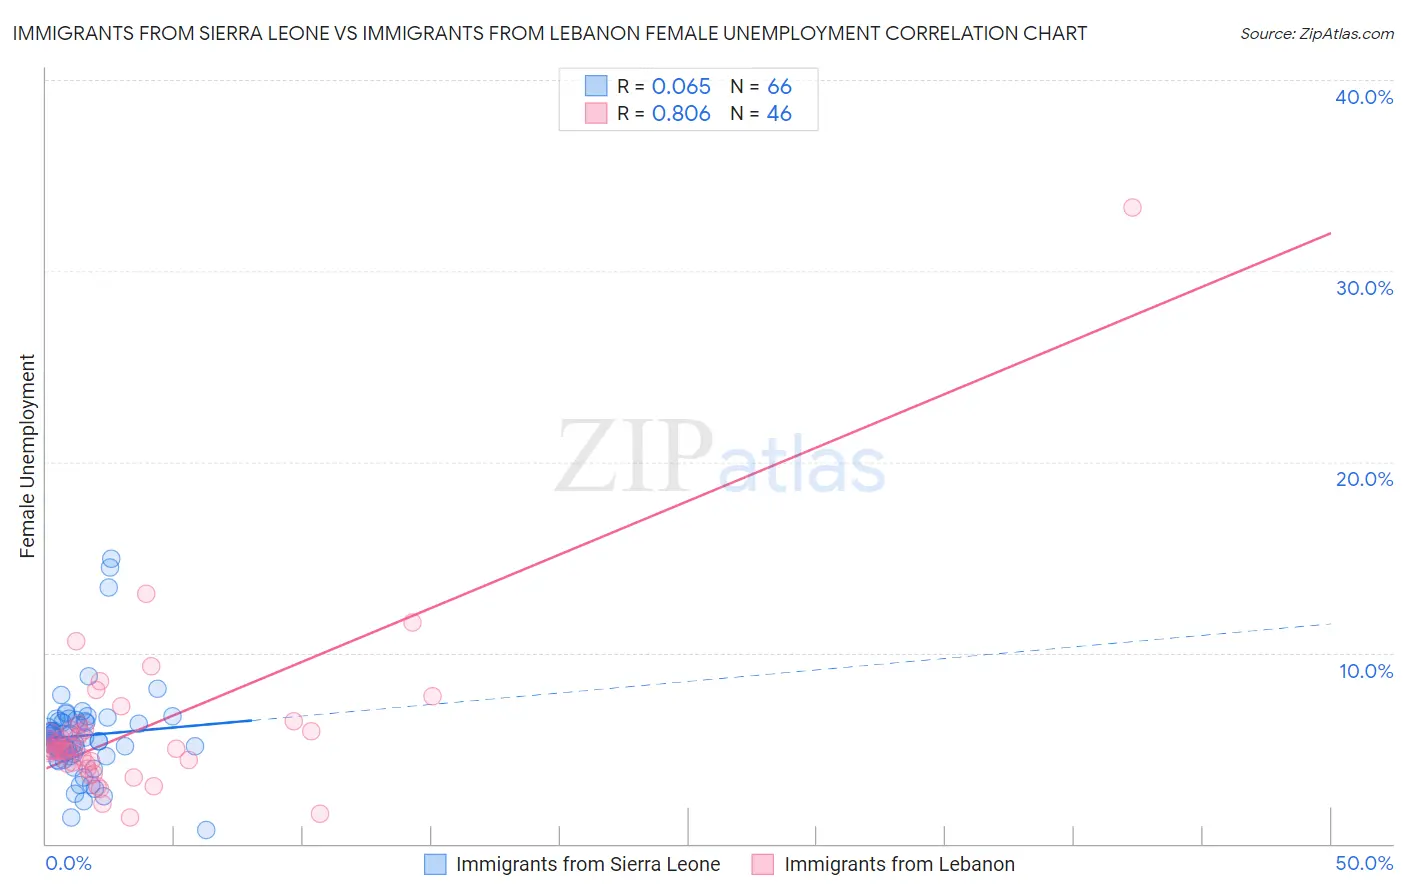
Immigrants from Sierra Leone vs Immigrants from Lebanon Female Unemployment Correlation Chart
The statistical analysis conducted on geographies consisting of 101,591,663 people shows a slight positive correlation between the proportion of Immigrants from Sierra Leone and unemploymnet rate among females in the United States with a correlation coefficient (R) of 0.065 and weighted average of 5.7%. Similarly, the statistical analysis conducted on geographies consisting of 216,922,483 people shows a very strong positive correlation between the proportion of Immigrants from Lebanon and unemploymnet rate among females in the United States with a correlation coefficient (R) of 0.806 and weighted average of 5.5%, a difference of 2.5%.
Female Unemployment Correlation Summary
| Measurement | Immigrants from Sierra Leone | Immigrants from Lebanon |
| Minimum | 0.70% | 1.4% |
| Maximum | 14.9% | 33.3% |
| Range | 14.2% | 31.9% |
| Mean | 5.7% | 6.0% |
| Median | 5.4% | 5.0% |
| Interquartile 25% (IQ1) | 4.7% | 4.2% |
| Interquartile 75% (IQ3) | 6.4% | 6.0% |
| Interquartile Range (IQR) | 1.7% | 1.8% |
| Standard Deviation (Sample) | 2.4% | 4.7% |
| Standard Deviation (Population) | 2.4% | 4.7% |
Demographics Similar to Immigrants from Sierra Leone and Immigrants from Lebanon by Female Unemployment
In terms of female unemployment, the demographic groups most similar to Immigrants from Sierra Leone are Cajun (5.7%, a difference of 0.15%), Assyrian/Chaldean/Syriac (5.6%, a difference of 0.34%), Immigrants from Syria (5.6%, a difference of 0.41%), Immigrants from Uzbekistan (5.6%, a difference of 0.70%), and Cree (5.6%, a difference of 0.74%). Similarly, the demographic groups most similar to Immigrants from Lebanon are Immigrants from Iran (5.5%, a difference of 0.0%), Moroccan (5.5%, a difference of 0.020%), Immigrants from Cambodia (5.5%, a difference of 0.040%), Immigrants from Panama (5.5%, a difference of 0.060%), and Sierra Leonean (5.5%, a difference of 0.080%).
| Demographics | Rating | Rank | Female Unemployment |
| Moroccans | 3.4 /100 | #233 | Tragic 5.5% |
| Immigrants | Lebanon | 3.3 /100 | #234 | Tragic 5.5% |
| Immigrants | Iran | 3.3 /100 | #235 | Tragic 5.5% |
| Immigrants | Cambodia | 3.3 /100 | #236 | Tragic 5.5% |
| Immigrants | Panama | 3.2 /100 | #237 | Tragic 5.5% |
| Sierra Leoneans | 3.2 /100 | #238 | Tragic 5.5% |
| Aleuts | 3.0 /100 | #239 | Tragic 5.5% |
| Immigrants | South America | 2.9 /100 | #240 | Tragic 5.5% |
| South American Indians | 2.8 /100 | #241 | Tragic 5.5% |
| Marshallese | 2.3 /100 | #242 | Tragic 5.6% |
| Spanish Americans | 2.2 /100 | #243 | Tragic 5.6% |
| Immigrants | Liberia | 1.5 /100 | #244 | Tragic 5.6% |
| Guamanians/Chamorros | 1.4 /100 | #245 | Tragic 5.6% |
| Japanese | 1.2 /100 | #246 | Tragic 5.6% |
| Immigrants | Western Asia | 1.1 /100 | #247 | Tragic 5.6% |
| Cree | 1.0 /100 | #248 | Tragic 5.6% |
| Immigrants | Uzbekistan | 1.0 /100 | #249 | Tragic 5.6% |
| Immigrants | Syria | 0.8 /100 | #250 | Tragic 5.6% |
| Assyrians/Chaldeans/Syriacs | 0.8 /100 | #251 | Tragic 5.6% |
| Cajuns | 0.7 /100 | #252 | Tragic 5.7% |
| Immigrants | Sierra Leone | 0.6 /100 | #253 | Tragic 5.7% |