Immigrants from Sierra Leone vs Honduran Female Unemployment
COMPARE
Immigrants from Sierra Leone
Honduran
Female Unemployment
Female Unemployment Comparison
Immigrants from Sierra Leone
Hondurans
5.7%
FEMALE UNEMPLOYMENT
0.6/ 100
METRIC RATING
253rd/ 347
METRIC RANK
5.9%
FEMALE UNEMPLOYMENT
0.0/ 100
METRIC RATING
268th/ 347
METRIC RANK
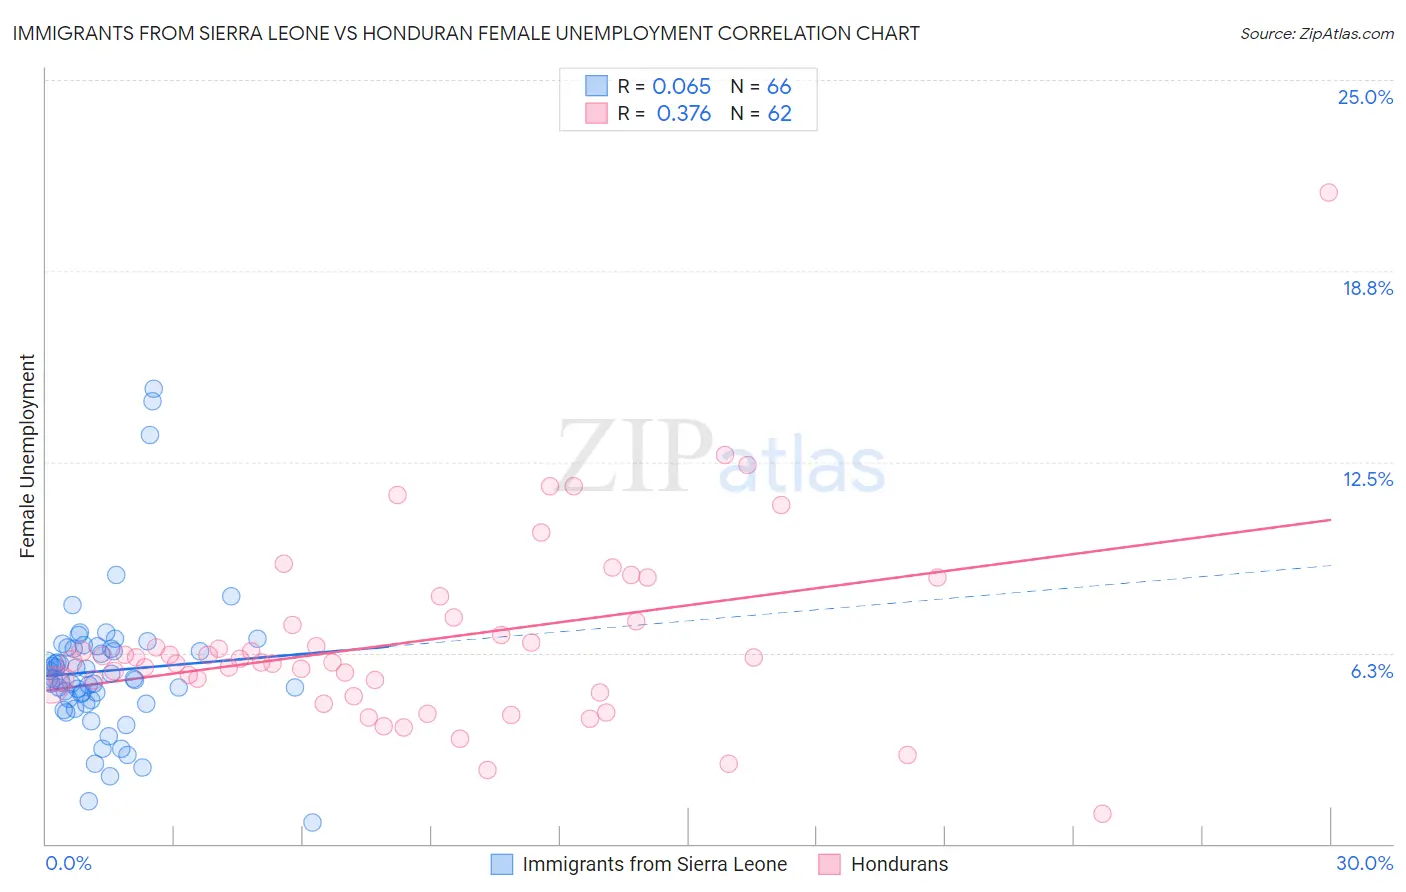
Immigrants from Sierra Leone vs Honduran Female Unemployment Correlation Chart
The statistical analysis conducted on geographies consisting of 101,591,663 people shows a slight positive correlation between the proportion of Immigrants from Sierra Leone and unemploymnet rate among females in the United States with a correlation coefficient (R) of 0.065 and weighted average of 5.7%. Similarly, the statistical analysis conducted on geographies consisting of 356,669,168 people shows a mild positive correlation between the proportion of Hondurans and unemploymnet rate among females in the United States with a correlation coefficient (R) of 0.376 and weighted average of 5.9%, a difference of 4.0%.
Female Unemployment Correlation Summary
| Measurement | Immigrants from Sierra Leone | Honduran |
| Minimum | 0.70% | 1.0% |
| Maximum | 14.9% | 21.3% |
| Range | 14.2% | 20.3% |
| Mean | 5.7% | 6.6% |
| Median | 5.4% | 6.0% |
| Interquartile 25% (IQ1) | 4.7% | 5.2% |
| Interquartile 75% (IQ3) | 6.4% | 7.3% |
| Interquartile Range (IQR) | 1.7% | 2.1% |
| Standard Deviation (Sample) | 2.4% | 3.1% |
| Standard Deviation (Population) | 2.4% | 3.1% |
Demographics Similar to Immigrants from Sierra Leone and Hondurans by Female Unemployment
In terms of female unemployment, the demographic groups most similar to Immigrants from Sierra Leone are Immigrants (5.7%, a difference of 0.0%), Immigrants from Cameroon (5.7%, a difference of 0.040%), Cajun (5.7%, a difference of 0.15%), Assyrian/Chaldean/Syriac (5.6%, a difference of 0.34%), and Immigrants from Syria (5.6%, a difference of 0.41%). Similarly, the demographic groups most similar to Hondurans are Nepalese (5.9%, a difference of 0.10%), Cape Verdean (5.9%, a difference of 0.20%), Immigrants from Western Africa (5.9%, a difference of 0.20%), Blackfeet (5.9%, a difference of 0.48%), and Immigrants from Honduras (5.9%, a difference of 0.61%).
| Demographics | Rating | Rank | Female Unemployment |
| Immigrants | Syria | 0.8 /100 | #250 | Tragic 5.6% |
| Assyrians/Chaldeans/Syriacs | 0.8 /100 | #251 | Tragic 5.6% |
| Cajuns | 0.7 /100 | #252 | Tragic 5.7% |
| Immigrants | Sierra Leone | 0.6 /100 | #253 | Tragic 5.7% |
| Immigrants | Immigrants | 0.6 /100 | #254 | Tragic 5.7% |
| Immigrants | Cameroon | 0.6 /100 | #255 | Tragic 5.7% |
| Sub-Saharan Africans | 0.4 /100 | #256 | Tragic 5.7% |
| Dutch West Indians | 0.3 /100 | #257 | Tragic 5.7% |
| Immigrants | Portugal | 0.2 /100 | #258 | Tragic 5.8% |
| Immigrants | Fiji | 0.2 /100 | #259 | Tragic 5.8% |
| Nigerians | 0.2 /100 | #260 | Tragic 5.8% |
| Kiowa | 0.1 /100 | #261 | Tragic 5.8% |
| Immigrants | Nigeria | 0.1 /100 | #262 | Tragic 5.8% |
| Immigrants | Azores | 0.1 /100 | #263 | Tragic 5.8% |
| Immigrants | Bahamas | 0.1 /100 | #264 | Tragic 5.8% |
| Blackfeet | 0.0 /100 | #265 | Tragic 5.9% |
| Cape Verdeans | 0.0 /100 | #266 | Tragic 5.9% |
| Nepalese | 0.0 /100 | #267 | Tragic 5.9% |
| Hondurans | 0.0 /100 | #268 | Tragic 5.9% |
| Immigrants | Western Africa | 0.0 /100 | #269 | Tragic 5.9% |
| Immigrants | Honduras | 0.0 /100 | #270 | Tragic 5.9% |