Immigrants from Sierra Leone vs Immigrants from Europe Female Unemployment
COMPARE
Immigrants from Sierra Leone
Immigrants from Europe
Female Unemployment
Female Unemployment Comparison
Immigrants from Sierra Leone
Immigrants from Europe
5.7%
FEMALE UNEMPLOYMENT
0.6/ 100
METRIC RATING
253rd/ 347
METRIC RANK
5.1%
FEMALE UNEMPLOYMENT
87.2/ 100
METRIC RATING
124th/ 347
METRIC RANK
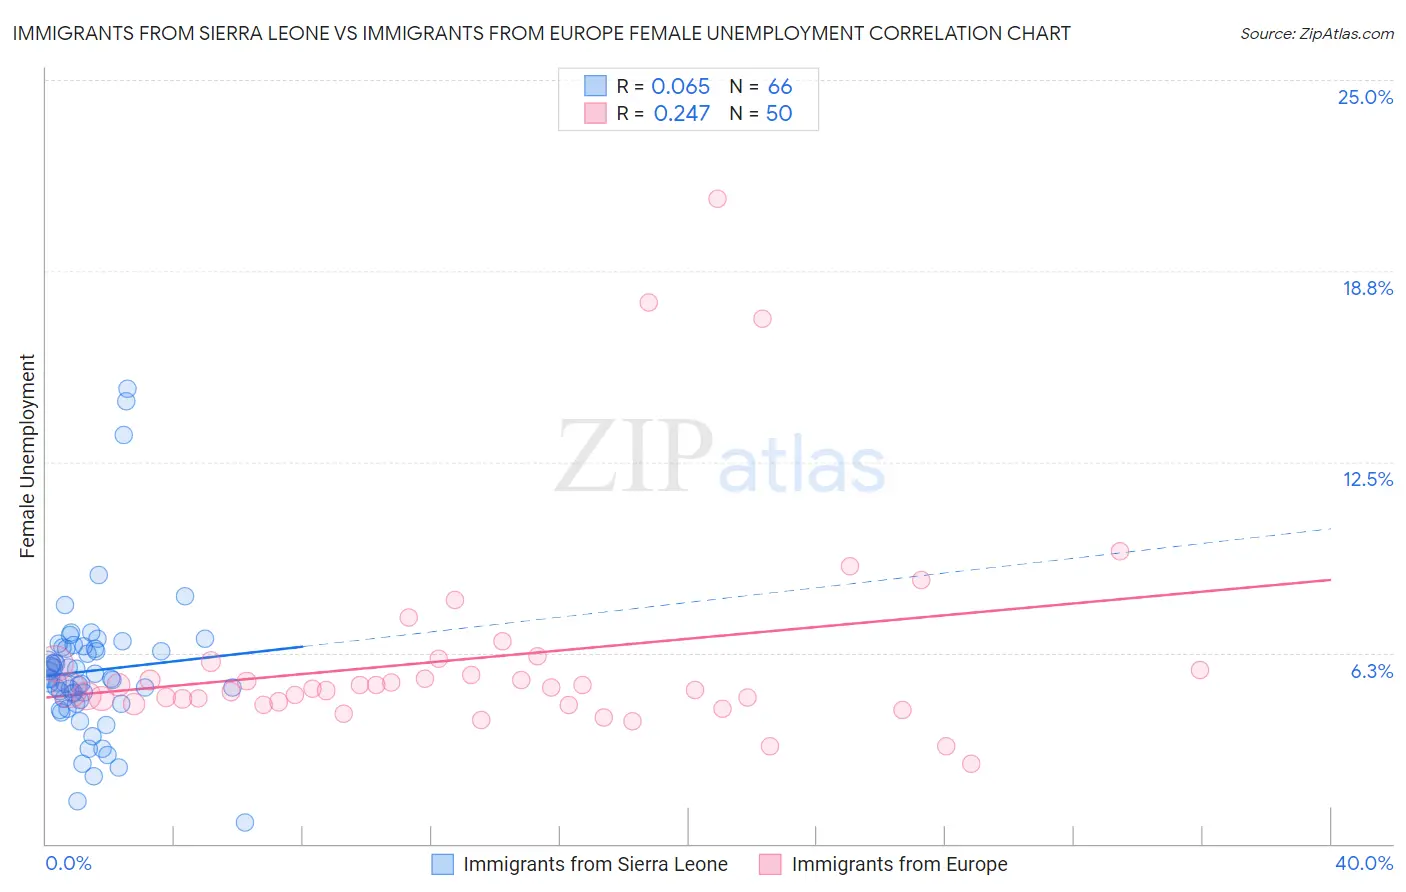
Immigrants from Sierra Leone vs Immigrants from Europe Female Unemployment Correlation Chart
The statistical analysis conducted on geographies consisting of 101,591,663 people shows a slight positive correlation between the proportion of Immigrants from Sierra Leone and unemploymnet rate among females in the United States with a correlation coefficient (R) of 0.065 and weighted average of 5.7%. Similarly, the statistical analysis conducted on geographies consisting of 538,568,700 people shows a weak positive correlation between the proportion of Immigrants from Europe and unemploymnet rate among females in the United States with a correlation coefficient (R) of 0.247 and weighted average of 5.1%, a difference of 10.9%.
Female Unemployment Correlation Summary
| Measurement | Immigrants from Sierra Leone | Immigrants from Europe |
| Minimum | 0.70% | 2.6% |
| Maximum | 14.9% | 21.1% |
| Range | 14.2% | 18.5% |
| Mean | 5.7% | 6.1% |
| Median | 5.4% | 5.1% |
| Interquartile 25% (IQ1) | 4.7% | 4.6% |
| Interquartile 75% (IQ3) | 6.4% | 5.9% |
| Interquartile Range (IQR) | 1.7% | 1.2% |
| Standard Deviation (Sample) | 2.4% | 3.5% |
| Standard Deviation (Population) | 2.4% | 3.5% |
Similar Demographics by Female Unemployment
Demographics Similar to Immigrants from Sierra Leone by Female Unemployment
In terms of female unemployment, the demographic groups most similar to Immigrants from Sierra Leone are Immigrants (5.7%, a difference of 0.0%), Immigrants from Cameroon (5.7%, a difference of 0.040%), Cajun (5.7%, a difference of 0.15%), Assyrian/Chaldean/Syriac (5.6%, a difference of 0.34%), and Immigrants from Syria (5.6%, a difference of 0.41%).
| Demographics | Rating | Rank | Female Unemployment |
| Japanese | 1.2 /100 | #246 | Tragic 5.6% |
| Immigrants | Western Asia | 1.1 /100 | #247 | Tragic 5.6% |
| Cree | 1.0 /100 | #248 | Tragic 5.6% |
| Immigrants | Uzbekistan | 1.0 /100 | #249 | Tragic 5.6% |
| Immigrants | Syria | 0.8 /100 | #250 | Tragic 5.6% |
| Assyrians/Chaldeans/Syriacs | 0.8 /100 | #251 | Tragic 5.6% |
| Cajuns | 0.7 /100 | #252 | Tragic 5.7% |
| Immigrants | Sierra Leone | 0.6 /100 | #253 | Tragic 5.7% |
| Immigrants | Immigrants | 0.6 /100 | #254 | Tragic 5.7% |
| Immigrants | Cameroon | 0.6 /100 | #255 | Tragic 5.7% |
| Sub-Saharan Africans | 0.4 /100 | #256 | Tragic 5.7% |
| Dutch West Indians | 0.3 /100 | #257 | Tragic 5.7% |
| Immigrants | Portugal | 0.2 /100 | #258 | Tragic 5.8% |
| Immigrants | Fiji | 0.2 /100 | #259 | Tragic 5.8% |
| Nigerians | 0.2 /100 | #260 | Tragic 5.8% |
Demographics Similar to Immigrants from Europe by Female Unemployment
In terms of female unemployment, the demographic groups most similar to Immigrants from Europe are Immigrants from Germany (5.1%, a difference of 0.050%), Immigrants from South Africa (5.1%, a difference of 0.050%), Basque (5.1%, a difference of 0.10%), Immigrants from Korea (5.1%, a difference of 0.12%), and Immigrants from Romania (5.1%, a difference of 0.13%).
| Demographics | Rating | Rank | Female Unemployment |
| Jordanians | 90.3 /100 | #117 | Exceptional 5.1% |
| Immigrants | Croatia | 89.9 /100 | #118 | Excellent 5.1% |
| Immigrants | North Macedonia | 88.3 /100 | #119 | Excellent 5.1% |
| Immigrants | Romania | 88.1 /100 | #120 | Excellent 5.1% |
| Immigrants | Western Europe | 88.1 /100 | #121 | Excellent 5.1% |
| Immigrants | Germany | 87.6 /100 | #122 | Excellent 5.1% |
| Immigrants | South Africa | 87.6 /100 | #123 | Excellent 5.1% |
| Immigrants | Europe | 87.2 /100 | #124 | Excellent 5.1% |
| Basques | 86.5 /100 | #125 | Excellent 5.1% |
| Immigrants | Korea | 86.3 /100 | #126 | Excellent 5.1% |
| Immigrants | Hungary | 86.0 /100 | #127 | Excellent 5.1% |
| Chileans | 85.8 /100 | #128 | Excellent 5.1% |
| Ethiopians | 85.7 /100 | #129 | Excellent 5.1% |
| Maltese | 85.5 /100 | #130 | Excellent 5.1% |
| Immigrants | Ethiopia | 85.4 /100 | #131 | Excellent 5.1% |