Immigrants from Serbia vs Immigrants from Trinidad and Tobago Unemployment Among Women with Children Ages 6 to 17 years
COMPARE
Immigrants from Serbia
Immigrants from Trinidad and Tobago
Unemployment Among Women with Children Ages 6 to 17 years
Unemployment Among Women with Children Ages 6 to 17 years Comparison
Immigrants from Serbia
Immigrants from Trinidad and Tobago
8.6%
UNEMPLOYMENT AMONG WOMEN WITH CHILDREN AGES 6 TO 17 YEARS
97.7/ 100
METRIC RATING
106th/ 347
METRIC RANK
9.1%
UNEMPLOYMENT AMONG WOMEN WITH CHILDREN AGES 6 TO 17 YEARS
16.7/ 100
METRIC RATING
201st/ 347
METRIC RANK
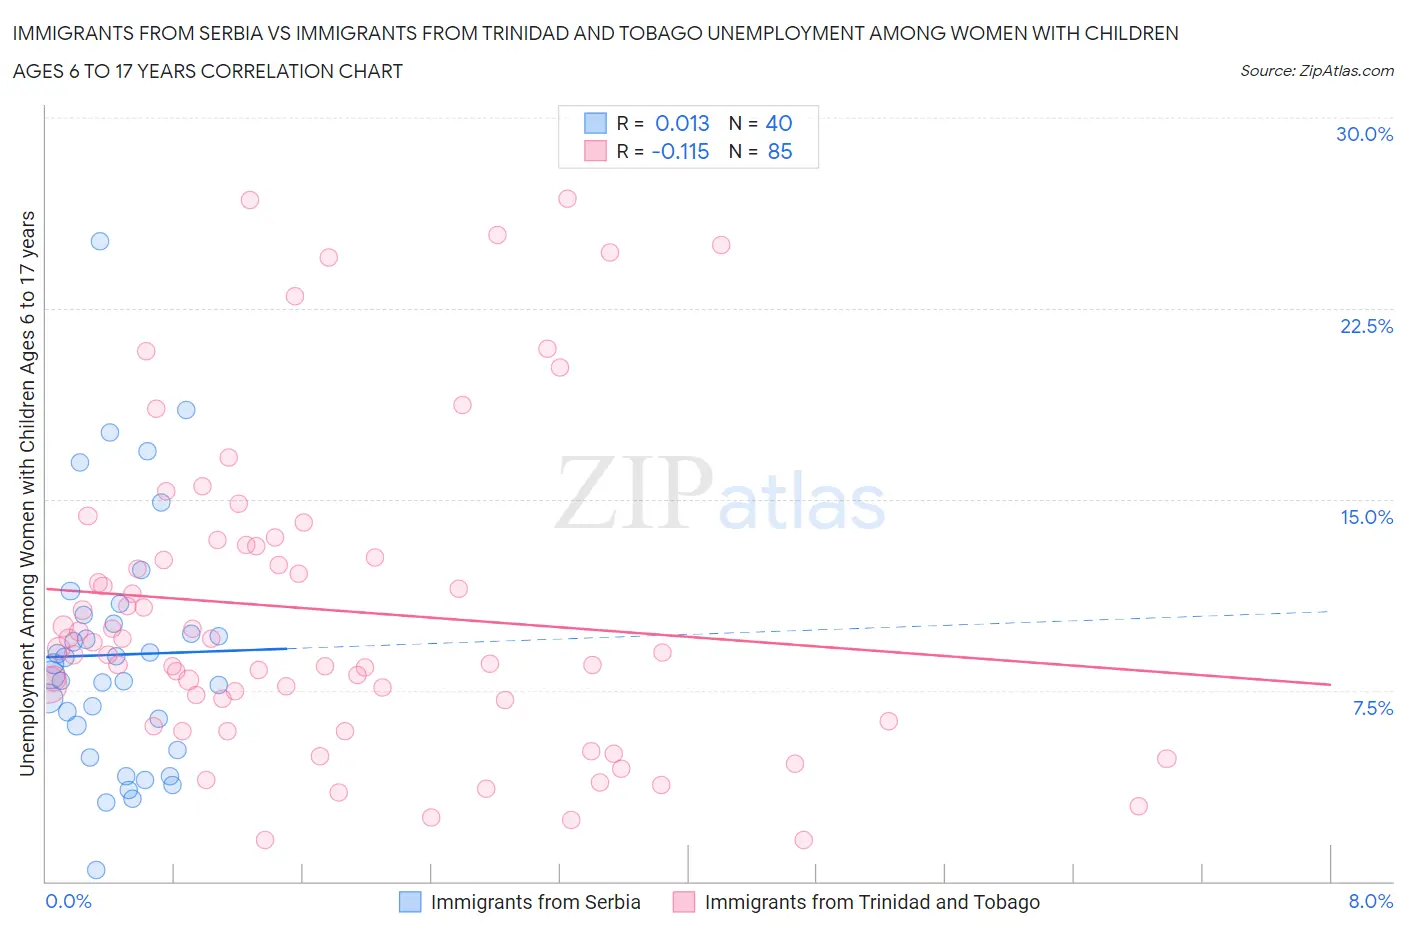
Immigrants from Serbia vs Immigrants from Trinidad and Tobago Unemployment Among Women with Children Ages 6 to 17 years Correlation Chart
The statistical analysis conducted on geographies consisting of 109,738,992 people shows no correlation between the proportion of Immigrants from Serbia and unemployment rate among women with children between the ages 6 and 17 in the United States with a correlation coefficient (R) of 0.013 and weighted average of 8.6%. Similarly, the statistical analysis conducted on geographies consisting of 179,476,892 people shows a poor negative correlation between the proportion of Immigrants from Trinidad and Tobago and unemployment rate among women with children between the ages 6 and 17 in the United States with a correlation coefficient (R) of -0.115 and weighted average of 9.1%, a difference of 6.2%.
Unemployment Among Women with Children Ages 6 to 17 years Correlation Summary
| Measurement | Immigrants from Serbia | Immigrants from Trinidad and Tobago |
| Minimum | 0.44% | 1.6% |
| Maximum | 25.1% | 26.8% |
| Range | 24.7% | 25.2% |
| Mean | 8.9% | 10.7% |
| Median | 8.3% | 9.1% |
| Interquartile 25% (IQ1) | 5.6% | 6.7% |
| Interquartile 75% (IQ3) | 10.3% | 13.2% |
| Interquartile Range (IQR) | 4.7% | 6.5% |
| Standard Deviation (Sample) | 4.9% | 6.1% |
| Standard Deviation (Population) | 4.8% | 6.1% |
Similar Demographics by Unemployment Among Women with Children Ages 6 to 17 years
Demographics Similar to Immigrants from Serbia by Unemployment Among Women with Children Ages 6 to 17 years
In terms of unemployment among women with children ages 6 to 17 years, the demographic groups most similar to Immigrants from Serbia are Chickasaw (8.6%, a difference of 0.030%), Immigrants from Norway (8.6%, a difference of 0.040%), Swedish (8.6%, a difference of 0.040%), Immigrants from Romania (8.6%, a difference of 0.11%), and Latvian (8.6%, a difference of 0.12%).
| Demographics | Rating | Rank | Unemployment Among Women with Children Ages 6 to 17 years |
| Immigrants | Lithuania | 98.4 /100 | #99 | Exceptional 8.6% |
| New Zealanders | 98.4 /100 | #100 | Exceptional 8.6% |
| Immigrants | Pakistan | 98.4 /100 | #101 | Exceptional 8.6% |
| Immigrants | South Africa | 98.3 /100 | #102 | Exceptional 8.6% |
| Scandinavians | 98.3 /100 | #103 | Exceptional 8.6% |
| Immigrants | France | 98.0 /100 | #104 | Exceptional 8.6% |
| Immigrants | Norway | 97.8 /100 | #105 | Exceptional 8.6% |
| Immigrants | Serbia | 97.7 /100 | #106 | Exceptional 8.6% |
| Chickasaw | 97.6 /100 | #107 | Exceptional 8.6% |
| Swedes | 97.6 /100 | #108 | Exceptional 8.6% |
| Immigrants | Romania | 97.5 /100 | #109 | Exceptional 8.6% |
| Latvians | 97.4 /100 | #110 | Exceptional 8.6% |
| Immigrants | Ukraine | 97.4 /100 | #111 | Exceptional 8.6% |
| Romanians | 97.1 /100 | #112 | Exceptional 8.6% |
| Eastern Europeans | 96.8 /100 | #113 | Exceptional 8.6% |
Demographics Similar to Immigrants from Trinidad and Tobago by Unemployment Among Women with Children Ages 6 to 17 years
In terms of unemployment among women with children ages 6 to 17 years, the demographic groups most similar to Immigrants from Trinidad and Tobago are Immigrants from Middle Africa (9.1%, a difference of 0.090%), Trinidadian and Tobagonian (9.1%, a difference of 0.11%), Maltese (9.1%, a difference of 0.11%), Immigrants from Canada (9.1%, a difference of 0.12%), and Immigrants from Western Europe (9.1%, a difference of 0.22%).
| Demographics | Rating | Rank | Unemployment Among Women with Children Ages 6 to 17 years |
| Immigrants | Kazakhstan | 25.3 /100 | #194 | Fair 9.1% |
| Austrians | 25.0 /100 | #195 | Fair 9.1% |
| Brazilians | 24.4 /100 | #196 | Fair 9.1% |
| Immigrants | Panama | 24.3 /100 | #197 | Fair 9.1% |
| Guyanese | 21.8 /100 | #198 | Fair 9.1% |
| Czechoslovakians | 20.8 /100 | #199 | Fair 9.1% |
| Trinidadians and Tobagonians | 18.2 /100 | #200 | Poor 9.1% |
| Immigrants | Trinidad and Tobago | 16.7 /100 | #201 | Poor 9.1% |
| Immigrants | Middle Africa | 15.6 /100 | #202 | Poor 9.1% |
| Maltese | 15.3 /100 | #203 | Poor 9.1% |
| Immigrants | Canada | 15.3 /100 | #204 | Poor 9.1% |
| Immigrants | Western Europe | 14.1 /100 | #205 | Poor 9.1% |
| Immigrants | North America | 12.7 /100 | #206 | Poor 9.2% |
| Cubans | 10.9 /100 | #207 | Poor 9.2% |
| Immigrants | Peru | 10.8 /100 | #208 | Poor 9.2% |