Immigrants from Senegal vs Immigrants from South Eastern Asia Male Unemployment
COMPARE
Immigrants from Senegal
Immigrants from South Eastern Asia
Male Unemployment
Male Unemployment Comparison
Immigrants from Senegal
Immigrants from South Eastern Asia
6.3%
MALE UNEMPLOYMENT
0.0/ 100
METRIC RATING
288th/ 347
METRIC RANK
5.4%
MALE UNEMPLOYMENT
28.2/ 100
METRIC RATING
191st/ 347
METRIC RANK
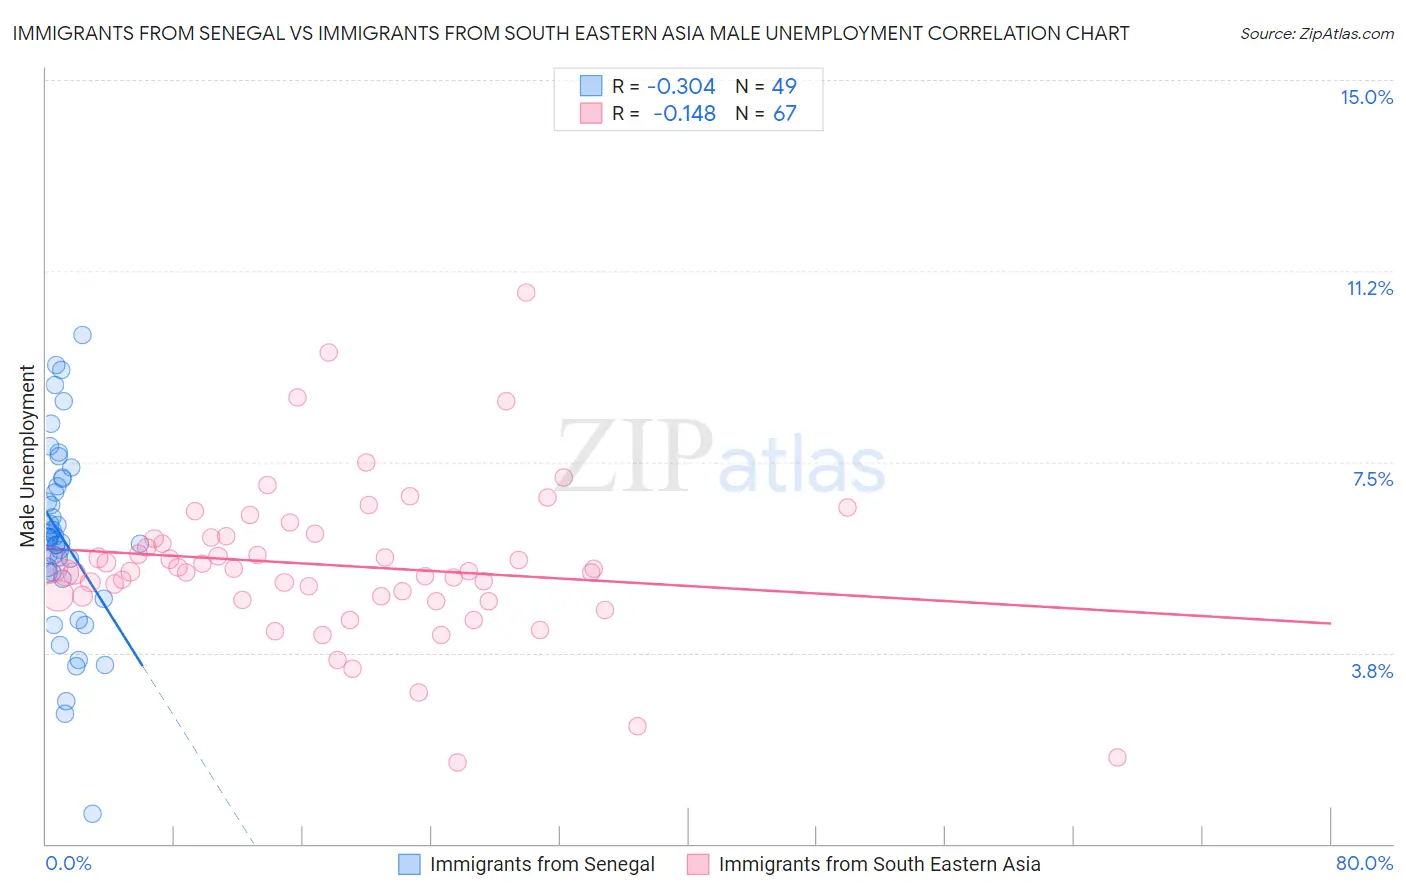
Immigrants from Senegal vs Immigrants from South Eastern Asia Male Unemployment Correlation Chart
The statistical analysis conducted on geographies consisting of 90,058,002 people shows a mild negative correlation between the proportion of Immigrants from Senegal and unemployment rate among males in the United States with a correlation coefficient (R) of -0.304 and weighted average of 6.3%. Similarly, the statistical analysis conducted on geographies consisting of 508,417,377 people shows a poor negative correlation between the proportion of Immigrants from South Eastern Asia and unemployment rate among males in the United States with a correlation coefficient (R) of -0.148 and weighted average of 5.4%, a difference of 16.9%.
Male Unemployment Correlation Summary
| Measurement | Immigrants from Senegal | Immigrants from South Eastern Asia |
| Minimum | 0.60% | 1.6% |
| Maximum | 10.0% | 10.8% |
| Range | 9.4% | 9.2% |
| Mean | 6.0% | 5.5% |
| Median | 6.0% | 5.3% |
| Interquartile 25% (IQ1) | 5.3% | 4.9% |
| Interquartile 75% (IQ3) | 7.1% | 6.0% |
| Interquartile Range (IQR) | 1.8% | 1.2% |
| Standard Deviation (Sample) | 1.8% | 1.5% |
| Standard Deviation (Population) | 1.8% | 1.5% |
Similar Demographics by Male Unemployment
Demographics Similar to Immigrants from Senegal by Male Unemployment
In terms of male unemployment, the demographic groups most similar to Immigrants from Senegal are Central American Indian (6.3%, a difference of 0.040%), Immigrants from Caribbean (6.3%, a difference of 0.12%), African (6.3%, a difference of 0.33%), Immigrants from Ecuador (6.2%, a difference of 0.76%), and Spanish American Indian (6.2%, a difference of 0.78%).
| Demographics | Rating | Rank | Male Unemployment |
| Sierra Leoneans | 0.0 /100 | #281 | Tragic 6.2% |
| Ecuadorians | 0.0 /100 | #282 | Tragic 6.2% |
| Immigrants | Western Africa | 0.0 /100 | #283 | Tragic 6.2% |
| Spanish American Indians | 0.0 /100 | #284 | Tragic 6.2% |
| Immigrants | Ecuador | 0.0 /100 | #285 | Tragic 6.2% |
| Africans | 0.0 /100 | #286 | Tragic 6.3% |
| Central American Indians | 0.0 /100 | #287 | Tragic 6.3% |
| Immigrants | Senegal | 0.0 /100 | #288 | Tragic 6.3% |
| Immigrants | Caribbean | 0.0 /100 | #289 | Tragic 6.3% |
| U.S. Virgin Islanders | 0.0 /100 | #290 | Tragic 6.4% |
| Immigrants | Azores | 0.0 /100 | #291 | Tragic 6.4% |
| Nepalese | 0.0 /100 | #292 | Tragic 6.4% |
| Haitians | 0.0 /100 | #293 | Tragic 6.4% |
| Senegalese | 0.0 /100 | #294 | Tragic 6.4% |
| Belizeans | 0.0 /100 | #295 | Tragic 6.5% |
Demographics Similar to Immigrants from South Eastern Asia by Male Unemployment
In terms of male unemployment, the demographic groups most similar to Immigrants from South Eastern Asia are Immigrants from Uganda (5.4%, a difference of 0.040%), Immigrants from South America (5.4%, a difference of 0.080%), Arab (5.4%, a difference of 0.14%), Immigrants from Belarus (5.4%, a difference of 0.16%), and Costa Rican (5.4%, a difference of 0.21%).
| Demographics | Rating | Rank | Male Unemployment |
| Spaniards | 35.1 /100 | #184 | Fair 5.3% |
| Koreans | 34.9 /100 | #185 | Fair 5.3% |
| Iraqis | 31.6 /100 | #186 | Fair 5.4% |
| Costa Ricans | 31.3 /100 | #187 | Fair 5.4% |
| Arabs | 30.2 /100 | #188 | Fair 5.4% |
| Immigrants | South America | 29.4 /100 | #189 | Fair 5.4% |
| Immigrants | Uganda | 28.8 /100 | #190 | Fair 5.4% |
| Immigrants | South Eastern Asia | 28.2 /100 | #191 | Fair 5.4% |
| Immigrants | Belarus | 26.0 /100 | #192 | Fair 5.4% |
| Immigrants | Israel | 25.2 /100 | #193 | Fair 5.4% |
| Spanish | 19.7 /100 | #194 | Poor 5.4% |
| Immigrants | Southern Europe | 17.7 /100 | #195 | Poor 5.4% |
| Albanians | 17.3 /100 | #196 | Poor 5.4% |
| Alsatians | 16.7 /100 | #197 | Poor 5.4% |
| Immigrants | Thailand | 14.7 /100 | #198 | Poor 5.4% |