Immigrants from Scotland vs Native Hawaiian Female Unemployment
COMPARE
Immigrants from Scotland
Native Hawaiian
Female Unemployment
Female Unemployment Comparison
Immigrants from Scotland
Native Hawaiians
4.9%
FEMALE UNEMPLOYMENT
98.6/ 100
METRIC RATING
60th/ 347
METRIC RANK
5.2%
FEMALE UNEMPLOYMENT
62.7/ 100
METRIC RATING
166th/ 347
METRIC RANK
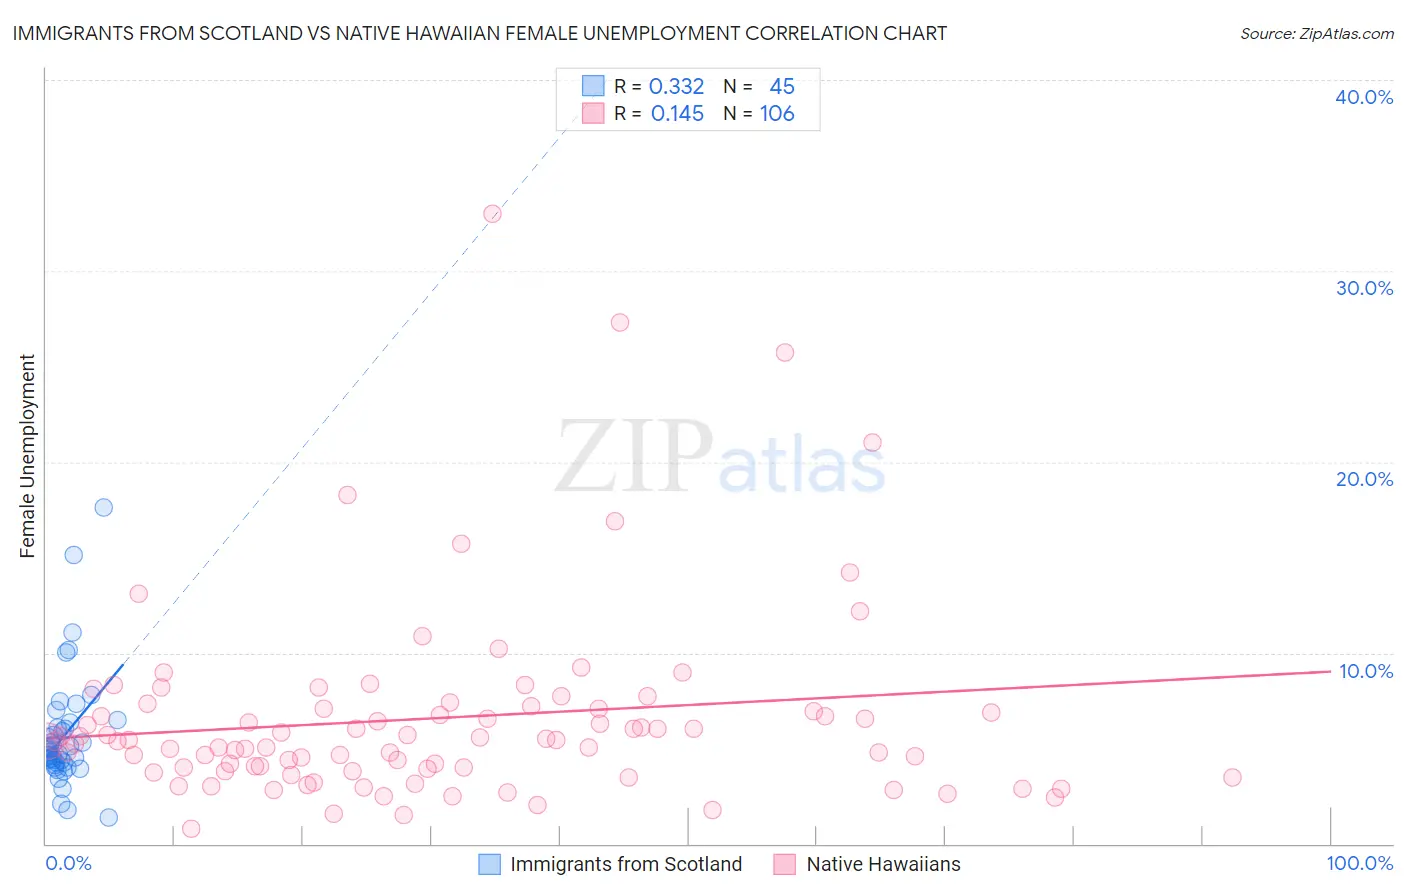
Immigrants from Scotland vs Native Hawaiian Female Unemployment Correlation Chart
The statistical analysis conducted on geographies consisting of 195,919,329 people shows a mild positive correlation between the proportion of Immigrants from Scotland and unemploymnet rate among females in the United States with a correlation coefficient (R) of 0.332 and weighted average of 4.9%. Similarly, the statistical analysis conducted on geographies consisting of 330,662,641 people shows a poor positive correlation between the proportion of Native Hawaiians and unemploymnet rate among females in the United States with a correlation coefficient (R) of 0.145 and weighted average of 5.2%, a difference of 6.0%.
Female Unemployment Correlation Summary
| Measurement | Immigrants from Scotland | Native Hawaiian |
| Minimum | 1.4% | 0.80% |
| Maximum | 17.6% | 33.0% |
| Range | 16.2% | 32.2% |
| Mean | 5.7% | 6.6% |
| Median | 4.8% | 5.4% |
| Interquartile 25% (IQ1) | 4.2% | 4.0% |
| Interquartile 75% (IQ3) | 6.2% | 7.1% |
| Interquartile Range (IQR) | 2.0% | 3.1% |
| Standard Deviation (Sample) | 3.0% | 5.1% |
| Standard Deviation (Population) | 3.0% | 5.1% |
Similar Demographics by Female Unemployment
Demographics Similar to Immigrants from Scotland by Female Unemployment
In terms of female unemployment, the demographic groups most similar to Immigrants from Scotland are Immigrants from Canada (4.9%, a difference of 0.010%), Immigrants from Nepal (4.9%, a difference of 0.010%), Bhutanese (4.9%, a difference of 0.080%), Immigrants from Belgium (4.9%, a difference of 0.12%), and Celtic (4.9%, a difference of 0.13%).
| Demographics | Rating | Rank | Female Unemployment |
| Whites/Caucasians | 99.0 /100 | #53 | Exceptional 4.9% |
| Immigrants | Zimbabwe | 99.0 /100 | #54 | Exceptional 4.9% |
| Immigrants | Moldova | 99.0 /100 | #55 | Exceptional 4.9% |
| Serbians | 99.0 /100 | #56 | Exceptional 4.9% |
| Icelanders | 98.8 /100 | #57 | Exceptional 4.9% |
| Immigrants | Lithuania | 98.8 /100 | #58 | Exceptional 4.9% |
| Bhutanese | 98.7 /100 | #59 | Exceptional 4.9% |
| Immigrants | Scotland | 98.6 /100 | #60 | Exceptional 4.9% |
| Immigrants | Canada | 98.6 /100 | #61 | Exceptional 4.9% |
| Immigrants | Nepal | 98.6 /100 | #62 | Exceptional 4.9% |
| Immigrants | Belgium | 98.5 /100 | #63 | Exceptional 4.9% |
| Celtics | 98.5 /100 | #64 | Exceptional 4.9% |
| Immigrants | North America | 98.3 /100 | #65 | Exceptional 4.9% |
| Hungarians | 98.3 /100 | #66 | Exceptional 4.9% |
| Cubans | 98.3 /100 | #67 | Exceptional 4.9% |
Demographics Similar to Native Hawaiians by Female Unemployment
In terms of female unemployment, the demographic groups most similar to Native Hawaiians are Syrian (5.2%, a difference of 0.0%), Immigrants from Thailand (5.2%, a difference of 0.040%), Immigrants from Asia (5.2%, a difference of 0.10%), Bangladeshi (5.2%, a difference of 0.10%), and Potawatomi (5.2%, a difference of 0.21%).
| Demographics | Rating | Rank | Female Unemployment |
| Immigrants | Micronesia | 66.9 /100 | #159 | Good 5.2% |
| Immigrants | Spain | 66.8 /100 | #160 | Good 5.2% |
| Immigrants | Pakistan | 66.7 /100 | #161 | Good 5.2% |
| Potawatomi | 65.9 /100 | #162 | Good 5.2% |
| Immigrants | Asia | 64.3 /100 | #163 | Good 5.2% |
| Bangladeshis | 64.3 /100 | #164 | Good 5.2% |
| Syrians | 62.8 /100 | #165 | Good 5.2% |
| Native Hawaiians | 62.7 /100 | #166 | Good 5.2% |
| Immigrants | Thailand | 62.1 /100 | #167 | Good 5.2% |
| Sri Lankans | 59.4 /100 | #168 | Average 5.2% |
| Immigrants | Chile | 59.0 /100 | #169 | Average 5.2% |
| Spanish | 55.9 /100 | #170 | Average 5.2% |
| Immigrants | Denmark | 55.0 /100 | #171 | Average 5.2% |
| Immigrants | Uganda | 50.7 /100 | #172 | Average 5.3% |
| Iranians | 50.4 /100 | #173 | Average 5.3% |