Immigrants from Scotland vs Cheyenne Female Unemployment
COMPARE
Immigrants from Scotland
Cheyenne
Female Unemployment
Female Unemployment Comparison
Immigrants from Scotland
Cheyenne
4.9%
FEMALE UNEMPLOYMENT
98.6/ 100
METRIC RATING
60th/ 347
METRIC RANK
6.6%
FEMALE UNEMPLOYMENT
0.0/ 100
METRIC RATING
324th/ 347
METRIC RANK
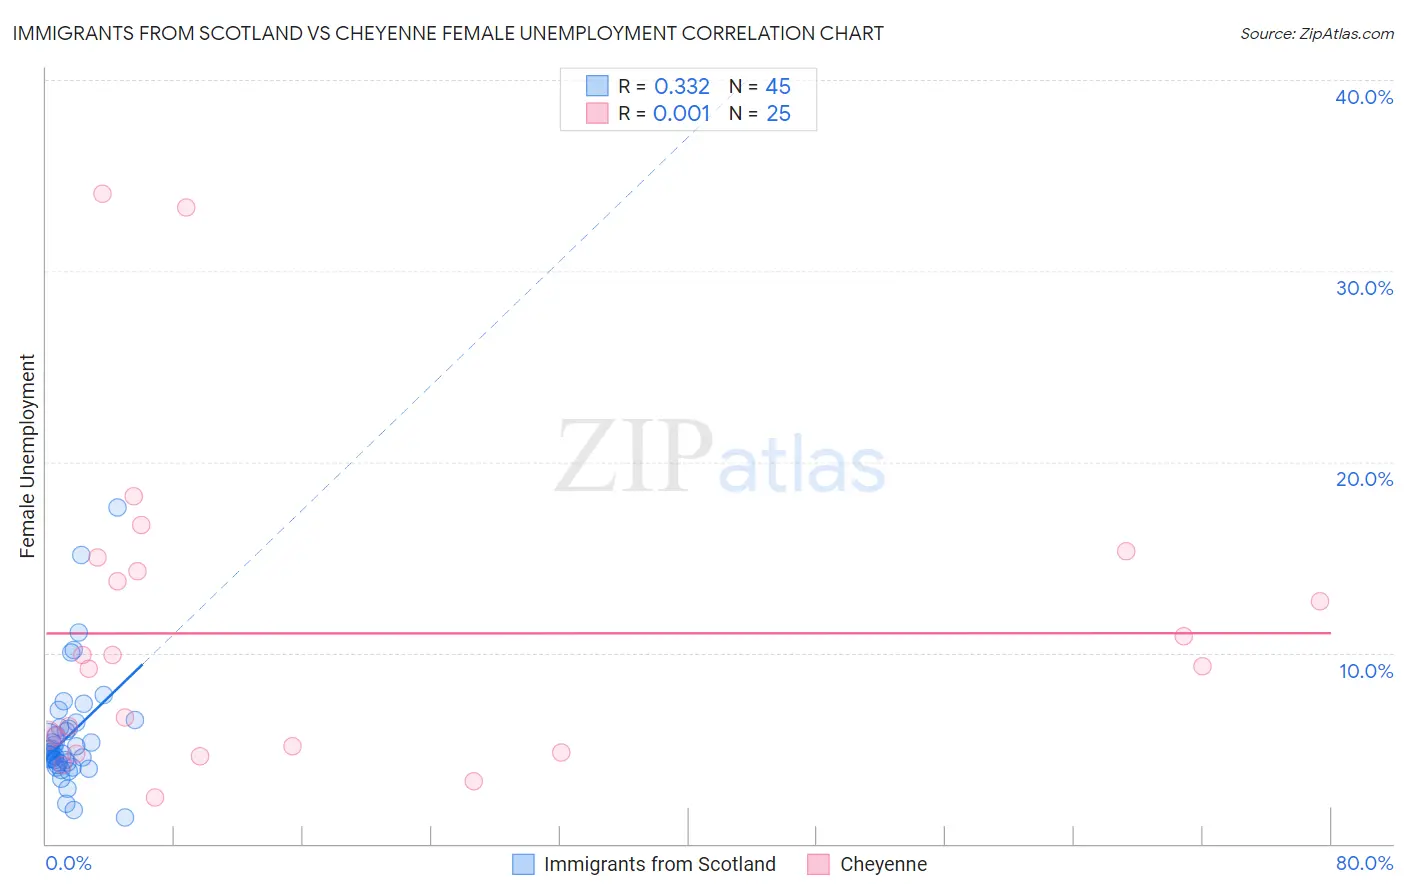
Immigrants from Scotland vs Cheyenne Female Unemployment Correlation Chart
The statistical analysis conducted on geographies consisting of 195,919,329 people shows a mild positive correlation between the proportion of Immigrants from Scotland and unemploymnet rate among females in the United States with a correlation coefficient (R) of 0.332 and weighted average of 4.9%. Similarly, the statistical analysis conducted on geographies consisting of 80,481,122 people shows no correlation between the proportion of Cheyenne and unemploymnet rate among females in the United States with a correlation coefficient (R) of 0.001 and weighted average of 6.6%, a difference of 33.5%.
Female Unemployment Correlation Summary
| Measurement | Immigrants from Scotland | Cheyenne |
| Minimum | 1.4% | 2.4% |
| Maximum | 17.6% | 34.0% |
| Range | 16.2% | 31.6% |
| Mean | 5.7% | 11.0% |
| Median | 4.8% | 9.3% |
| Interquartile 25% (IQ1) | 4.2% | 5.0% |
| Interquartile 75% (IQ3) | 6.2% | 14.6% |
| Interquartile Range (IQR) | 2.0% | 9.7% |
| Standard Deviation (Sample) | 3.0% | 8.2% |
| Standard Deviation (Population) | 3.0% | 8.0% |
Similar Demographics by Female Unemployment
Demographics Similar to Immigrants from Scotland by Female Unemployment
In terms of female unemployment, the demographic groups most similar to Immigrants from Scotland are Immigrants from Canada (4.9%, a difference of 0.010%), Immigrants from Nepal (4.9%, a difference of 0.010%), Bhutanese (4.9%, a difference of 0.080%), Immigrants from Belgium (4.9%, a difference of 0.12%), and Celtic (4.9%, a difference of 0.13%).
| Demographics | Rating | Rank | Female Unemployment |
| Whites/Caucasians | 99.0 /100 | #53 | Exceptional 4.9% |
| Immigrants | Zimbabwe | 99.0 /100 | #54 | Exceptional 4.9% |
| Immigrants | Moldova | 99.0 /100 | #55 | Exceptional 4.9% |
| Serbians | 99.0 /100 | #56 | Exceptional 4.9% |
| Icelanders | 98.8 /100 | #57 | Exceptional 4.9% |
| Immigrants | Lithuania | 98.8 /100 | #58 | Exceptional 4.9% |
| Bhutanese | 98.7 /100 | #59 | Exceptional 4.9% |
| Immigrants | Scotland | 98.6 /100 | #60 | Exceptional 4.9% |
| Immigrants | Canada | 98.6 /100 | #61 | Exceptional 4.9% |
| Immigrants | Nepal | 98.6 /100 | #62 | Exceptional 4.9% |
| Immigrants | Belgium | 98.5 /100 | #63 | Exceptional 4.9% |
| Celtics | 98.5 /100 | #64 | Exceptional 4.9% |
| Immigrants | North America | 98.3 /100 | #65 | Exceptional 4.9% |
| Hungarians | 98.3 /100 | #66 | Exceptional 4.9% |
| Cubans | 98.3 /100 | #67 | Exceptional 4.9% |
Demographics Similar to Cheyenne by Female Unemployment
In terms of female unemployment, the demographic groups most similar to Cheyenne are Apache (6.6%, a difference of 0.27%), Native/Alaskan (6.6%, a difference of 0.83%), Alaska Native (6.6%, a difference of 0.91%), Immigrants from Belize (6.5%, a difference of 1.1%), and Vietnamese (6.5%, a difference of 1.2%).
| Demographics | Rating | Rank | Female Unemployment |
| Immigrants | St. Vincent and the Grenadines | 0.0 /100 | #317 | Tragic 6.4% |
| British West Indians | 0.0 /100 | #318 | Tragic 6.4% |
| Immigrants | Bangladesh | 0.0 /100 | #319 | Tragic 6.5% |
| Immigrants | Dominica | 0.0 /100 | #320 | Tragic 6.5% |
| Blacks/African Americans | 0.0 /100 | #321 | Tragic 6.5% |
| Vietnamese | 0.0 /100 | #322 | Tragic 6.5% |
| Immigrants | Belize | 0.0 /100 | #323 | Tragic 6.5% |
| Cheyenne | 0.0 /100 | #324 | Tragic 6.6% |
| Apache | 0.0 /100 | #325 | Tragic 6.6% |
| Natives/Alaskans | 0.0 /100 | #326 | Tragic 6.6% |
| Alaska Natives | 0.0 /100 | #327 | Tragic 6.6% |
| Guyanese | 0.0 /100 | #328 | Tragic 6.7% |
| Immigrants | Guyana | 0.0 /100 | #329 | Tragic 6.7% |
| Yakama | 0.0 /100 | #330 | Tragic 6.7% |
| Paiute | 0.0 /100 | #331 | Tragic 6.8% |