Immigrants from Scotland vs Ghanaian Female Unemployment
COMPARE
Immigrants from Scotland
Ghanaian
Female Unemployment
Female Unemployment Comparison
Immigrants from Scotland
Ghanaians
4.9%
FEMALE UNEMPLOYMENT
98.6/ 100
METRIC RATING
60th/ 347
METRIC RANK
5.9%
FEMALE UNEMPLOYMENT
0.0/ 100
METRIC RATING
273rd/ 347
METRIC RANK
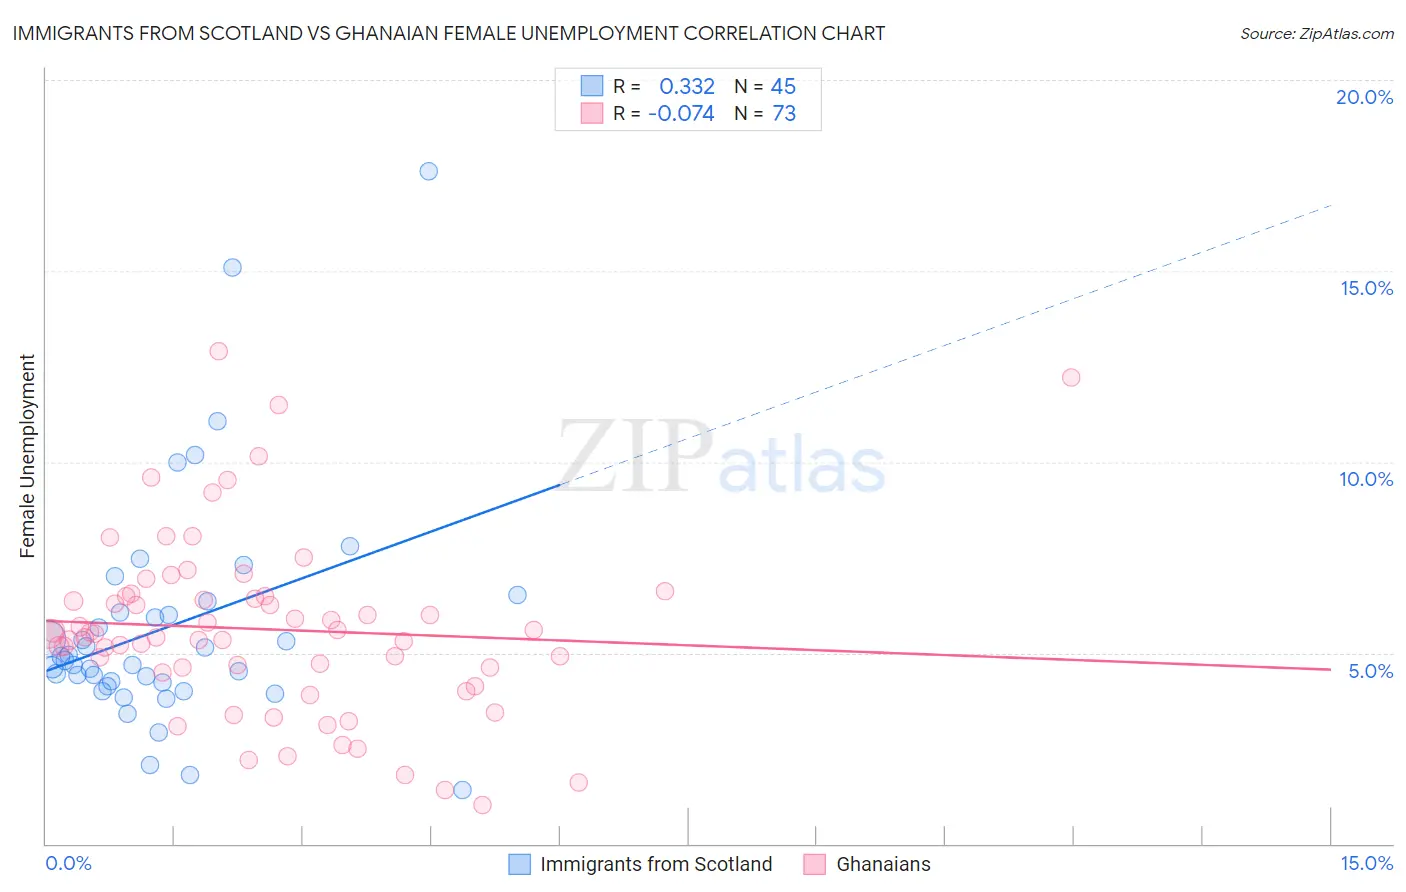
Immigrants from Scotland vs Ghanaian Female Unemployment Correlation Chart
The statistical analysis conducted on geographies consisting of 195,919,329 people shows a mild positive correlation between the proportion of Immigrants from Scotland and unemploymnet rate among females in the United States with a correlation coefficient (R) of 0.332 and weighted average of 4.9%. Similarly, the statistical analysis conducted on geographies consisting of 190,507,316 people shows a slight negative correlation between the proportion of Ghanaians and unemploymnet rate among females in the United States with a correlation coefficient (R) of -0.074 and weighted average of 5.9%, a difference of 20.8%.
Female Unemployment Correlation Summary
| Measurement | Immigrants from Scotland | Ghanaian |
| Minimum | 1.4% | 1.0% |
| Maximum | 17.6% | 12.9% |
| Range | 16.2% | 11.9% |
| Mean | 5.7% | 5.6% |
| Median | 4.8% | 5.5% |
| Interquartile 25% (IQ1) | 4.2% | 4.5% |
| Interquartile 75% (IQ3) | 6.2% | 6.5% |
| Interquartile Range (IQR) | 2.0% | 1.9% |
| Standard Deviation (Sample) | 3.0% | 2.3% |
| Standard Deviation (Population) | 3.0% | 2.3% |
Similar Demographics by Female Unemployment
Demographics Similar to Immigrants from Scotland by Female Unemployment
In terms of female unemployment, the demographic groups most similar to Immigrants from Scotland are Immigrants from Canada (4.9%, a difference of 0.010%), Immigrants from Nepal (4.9%, a difference of 0.010%), Bhutanese (4.9%, a difference of 0.080%), Immigrants from Belgium (4.9%, a difference of 0.12%), and Celtic (4.9%, a difference of 0.13%).
| Demographics | Rating | Rank | Female Unemployment |
| Whites/Caucasians | 99.0 /100 | #53 | Exceptional 4.9% |
| Immigrants | Zimbabwe | 99.0 /100 | #54 | Exceptional 4.9% |
| Immigrants | Moldova | 99.0 /100 | #55 | Exceptional 4.9% |
| Serbians | 99.0 /100 | #56 | Exceptional 4.9% |
| Icelanders | 98.8 /100 | #57 | Exceptional 4.9% |
| Immigrants | Lithuania | 98.8 /100 | #58 | Exceptional 4.9% |
| Bhutanese | 98.7 /100 | #59 | Exceptional 4.9% |
| Immigrants | Scotland | 98.6 /100 | #60 | Exceptional 4.9% |
| Immigrants | Canada | 98.6 /100 | #61 | Exceptional 4.9% |
| Immigrants | Nepal | 98.6 /100 | #62 | Exceptional 4.9% |
| Immigrants | Belgium | 98.5 /100 | #63 | Exceptional 4.9% |
| Celtics | 98.5 /100 | #64 | Exceptional 4.9% |
| Immigrants | North America | 98.3 /100 | #65 | Exceptional 4.9% |
| Hungarians | 98.3 /100 | #66 | Exceptional 4.9% |
| Cubans | 98.3 /100 | #67 | Exceptional 4.9% |
Demographics Similar to Ghanaians by Female Unemployment
In terms of female unemployment, the demographic groups most similar to Ghanaians are Lumbee (5.9%, a difference of 0.010%), African (5.9%, a difference of 0.080%), Central American (5.9%, a difference of 0.20%), Immigrants from Honduras (5.9%, a difference of 0.30%), and Senegalese (6.0%, a difference of 0.57%).
| Demographics | Rating | Rank | Female Unemployment |
| Cape Verdeans | 0.0 /100 | #266 | Tragic 5.9% |
| Nepalese | 0.0 /100 | #267 | Tragic 5.9% |
| Hondurans | 0.0 /100 | #268 | Tragic 5.9% |
| Immigrants | Western Africa | 0.0 /100 | #269 | Tragic 5.9% |
| Immigrants | Honduras | 0.0 /100 | #270 | Tragic 5.9% |
| Central Americans | 0.0 /100 | #271 | Tragic 5.9% |
| Lumbee | 0.0 /100 | #272 | Tragic 5.9% |
| Ghanaians | 0.0 /100 | #273 | Tragic 5.9% |
| Africans | 0.0 /100 | #274 | Tragic 5.9% |
| Senegalese | 0.0 /100 | #275 | Tragic 6.0% |
| Bahamians | 0.0 /100 | #276 | Tragic 6.0% |
| Immigrants | Ghana | 0.0 /100 | #277 | Tragic 6.0% |
| Yaqui | 0.0 /100 | #278 | Tragic 6.0% |
| Armenians | 0.0 /100 | #279 | Tragic 6.0% |
| Mexican American Indians | 0.0 /100 | #280 | Tragic 6.0% |