Immigrants from Eritrea vs Immigrants from Northern Africa Unemployment
COMPARE
Immigrants from Eritrea
Immigrants from Northern Africa
Unemployment
Unemployment Comparison
Immigrants from Eritrea
Immigrants from Northern Africa
5.0%
UNEMPLOYMENT
93.3/ 100
METRIC RATING
109th/ 347
METRIC RANK
5.2%
UNEMPLOYMENT
71.3/ 100
METRIC RATING
155th/ 347
METRIC RANK
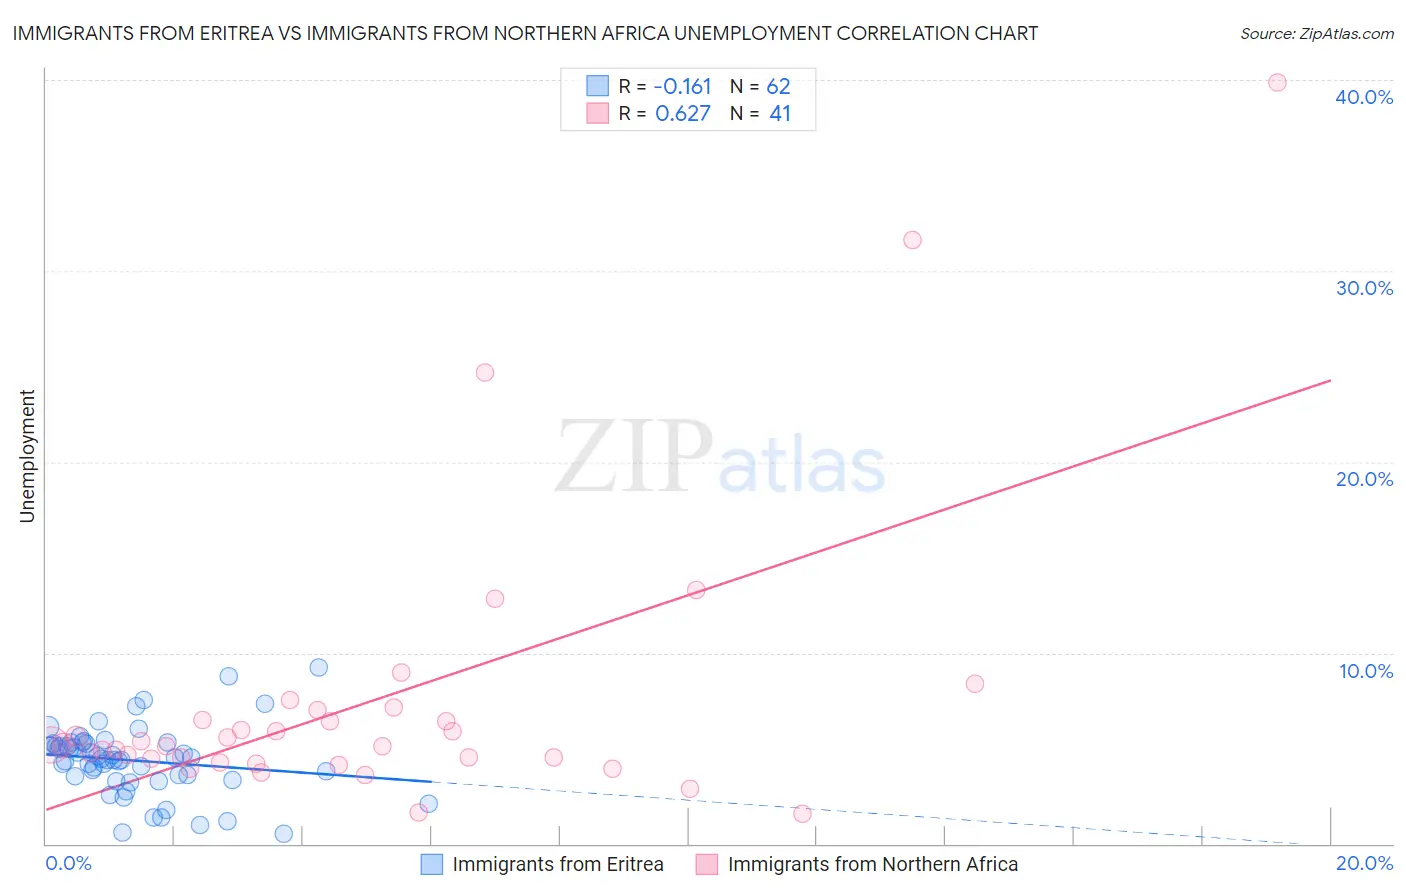
Immigrants from Eritrea vs Immigrants from Northern Africa Unemployment Correlation Chart
The statistical analysis conducted on geographies consisting of 104,849,484 people shows a poor negative correlation between the proportion of Immigrants from Eritrea and unemployment in the United States with a correlation coefficient (R) of -0.161 and weighted average of 5.0%. Similarly, the statistical analysis conducted on geographies consisting of 321,091,849 people shows a significant positive correlation between the proportion of Immigrants from Northern Africa and unemployment in the United States with a correlation coefficient (R) of 0.627 and weighted average of 5.2%, a difference of 2.8%.
Unemployment Correlation Summary
| Measurement | Immigrants from Eritrea | Immigrants from Northern Africa |
| Minimum | 0.50% | 1.6% |
| Maximum | 9.2% | 39.9% |
| Range | 8.7% | 38.3% |
| Mean | 4.4% | 7.5% |
| Median | 4.5% | 5.2% |
| Interquartile 25% (IQ1) | 3.5% | 4.4% |
| Interquartile 75% (IQ3) | 5.2% | 6.7% |
| Interquartile Range (IQR) | 1.7% | 2.4% |
| Standard Deviation (Sample) | 1.8% | 7.5% |
| Standard Deviation (Population) | 1.7% | 7.5% |
Similar Demographics by Unemployment
Demographics Similar to Immigrants from Eritrea by Unemployment
In terms of unemployment, the demographic groups most similar to Immigrants from Eritrea are Immigrants from Lithuania (5.0%, a difference of 0.020%), Chilean (5.0%, a difference of 0.020%), Immigrants from Kuwait (5.0%, a difference of 0.10%), Immigrants from Turkey (5.0%, a difference of 0.11%), and Immigrants from Romania (5.0%, a difference of 0.12%).
| Demographics | Rating | Rank | Unemployment |
| Immigrants | Argentina | 94.1 /100 | #102 | Exceptional 5.0% |
| Chickasaw | 94.0 /100 | #103 | Exceptional 5.0% |
| Osage | 94.0 /100 | #104 | Exceptional 5.0% |
| Maltese | 94.0 /100 | #105 | Exceptional 5.0% |
| Immigrants | Romania | 93.7 /100 | #106 | Exceptional 5.0% |
| Immigrants | Turkey | 93.7 /100 | #107 | Exceptional 5.0% |
| Immigrants | Kuwait | 93.7 /100 | #108 | Exceptional 5.0% |
| Immigrants | Eritrea | 93.3 /100 | #109 | Exceptional 5.0% |
| Immigrants | Lithuania | 93.2 /100 | #110 | Exceptional 5.0% |
| Chileans | 93.2 /100 | #111 | Exceptional 5.0% |
| South Africans | 92.6 /100 | #112 | Exceptional 5.1% |
| Argentineans | 92.4 /100 | #113 | Exceptional 5.1% |
| Immigrants | Ireland | 92.1 /100 | #114 | Exceptional 5.1% |
| Immigrants | Western Europe | 91.1 /100 | #115 | Exceptional 5.1% |
| Immigrants | Sri Lanka | 91.1 /100 | #116 | Exceptional 5.1% |
Demographics Similar to Immigrants from Northern Africa by Unemployment
In terms of unemployment, the demographic groups most similar to Immigrants from Northern Africa are Immigrants from Kazakhstan (5.2%, a difference of 0.070%), Sri Lankan (5.2%, a difference of 0.13%), Immigrants from China (5.2%, a difference of 0.28%), Immigrants from Eastern Europe (5.2%, a difference of 0.32%), and Immigrants from Hong Kong (5.2%, a difference of 0.32%).
| Demographics | Rating | Rank | Unemployment |
| Immigrants | Italy | 79.1 /100 | #148 | Good 5.1% |
| Syrians | 77.7 /100 | #149 | Good 5.2% |
| Potawatomi | 76.2 /100 | #150 | Good 5.2% |
| Immigrants | Eastern Europe | 75.3 /100 | #151 | Good 5.2% |
| Immigrants | Hong Kong | 75.2 /100 | #152 | Good 5.2% |
| Egyptians | 75.2 /100 | #153 | Good 5.2% |
| Immigrants | China | 74.7 /100 | #154 | Good 5.2% |
| Immigrants | Northern Africa | 71.3 /100 | #155 | Good 5.2% |
| Immigrants | Kazakhstan | 70.4 /100 | #156 | Good 5.2% |
| Sri Lankans | 69.5 /100 | #157 | Good 5.2% |
| Immigrants | Egypt | 66.7 /100 | #158 | Good 5.2% |
| Immigrants | Russia | 66.6 /100 | #159 | Good 5.2% |
| Laotians | 66.3 /100 | #160 | Good 5.2% |
| Immigrants | Oceania | 65.2 /100 | #161 | Good 5.2% |
| Spanish | 65.1 /100 | #162 | Good 5.2% |