Immigrants from Congo vs Immigrants from Northern Africa Unemployment
COMPARE
Immigrants from Congo
Immigrants from Northern Africa
Unemployment
Unemployment Comparison
Immigrants from Congo
Immigrants from Northern Africa
5.3%
UNEMPLOYMENT
50.0/ 100
METRIC RATING
174th/ 347
METRIC RANK
5.2%
UNEMPLOYMENT
71.3/ 100
METRIC RATING
155th/ 347
METRIC RANK
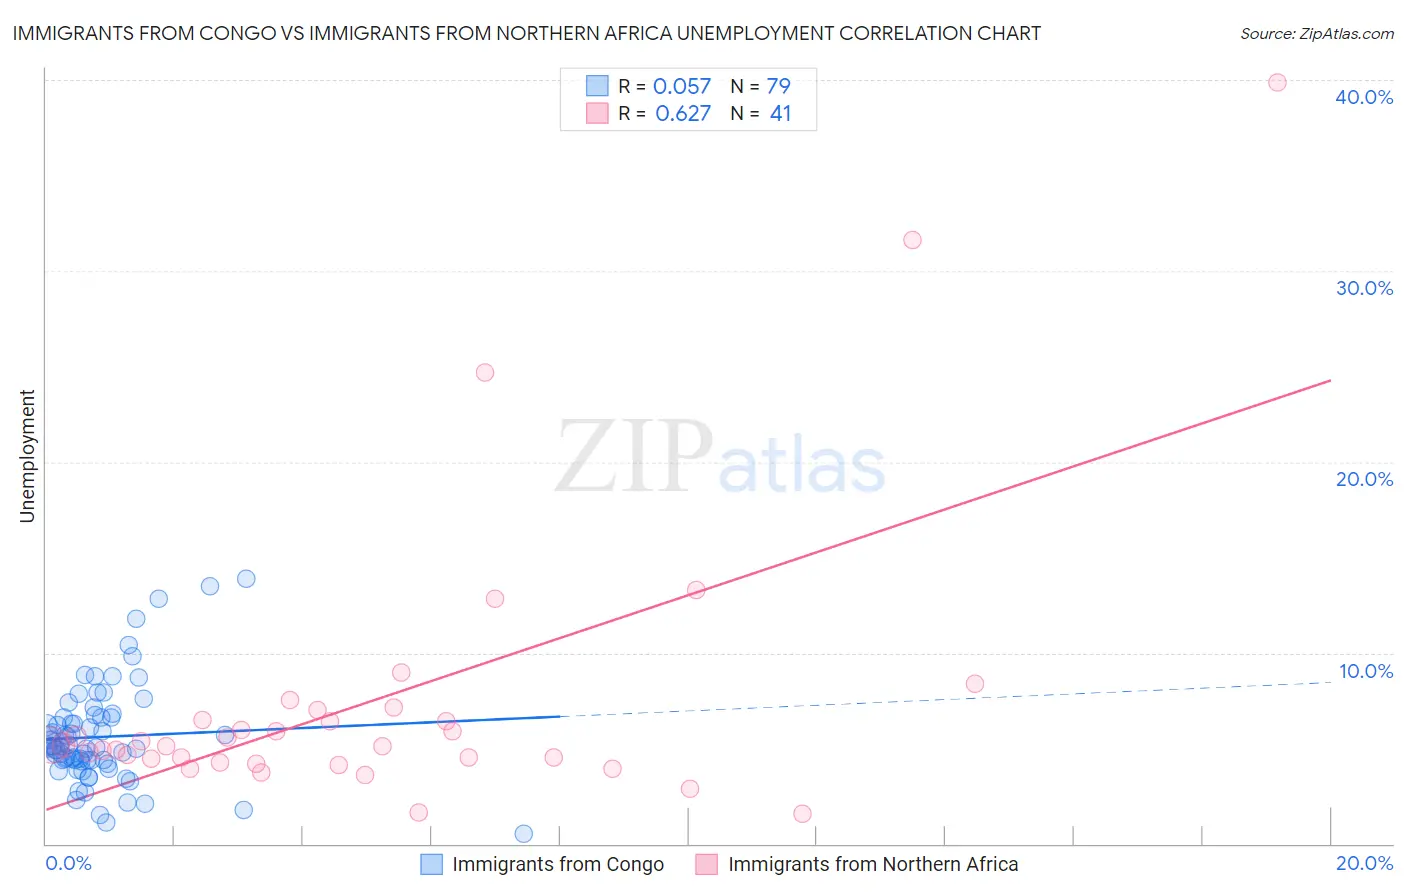
Immigrants from Congo vs Immigrants from Northern Africa Unemployment Correlation Chart
The statistical analysis conducted on geographies consisting of 92,111,963 people shows a slight positive correlation between the proportion of Immigrants from Congo and unemployment in the United States with a correlation coefficient (R) of 0.057 and weighted average of 5.3%. Similarly, the statistical analysis conducted on geographies consisting of 321,091,849 people shows a significant positive correlation between the proportion of Immigrants from Northern Africa and unemployment in the United States with a correlation coefficient (R) of 0.627 and weighted average of 5.2%, a difference of 1.4%.
Unemployment Correlation Summary
| Measurement | Immigrants from Congo | Immigrants from Northern Africa |
| Minimum | 0.50% | 1.6% |
| Maximum | 13.9% | 39.9% |
| Range | 13.4% | 38.3% |
| Mean | 5.6% | 7.5% |
| Median | 5.1% | 5.2% |
| Interquartile 25% (IQ1) | 4.4% | 4.4% |
| Interquartile 75% (IQ3) | 6.6% | 6.7% |
| Interquartile Range (IQR) | 2.2% | 2.4% |
| Standard Deviation (Sample) | 2.6% | 7.5% |
| Standard Deviation (Population) | 2.6% | 7.5% |
Demographics Similar to Immigrants from Congo and Immigrants from Northern Africa by Unemployment
In terms of unemployment, the demographic groups most similar to Immigrants from Congo are Immigrants from Poland (5.3%, a difference of 0.11%), Immigrants from Vietnam (5.2%, a difference of 0.15%), Puget Sound Salish (5.2%, a difference of 0.41%), Immigrants from Nicaragua (5.2%, a difference of 0.44%), and Immigrants from Morocco (5.2%, a difference of 0.57%). Similarly, the demographic groups most similar to Immigrants from Northern Africa are Immigrants from Kazakhstan (5.2%, a difference of 0.070%), Sri Lankan (5.2%, a difference of 0.13%), Immigrants from China (5.2%, a difference of 0.28%), Immigrants from Egypt (5.2%, a difference of 0.33%), and Immigrants from Russia (5.2%, a difference of 0.34%).
| Demographics | Rating | Rank | Unemployment |
| Immigrants | China | 74.7 /100 | #154 | Good 5.2% |
| Immigrants | Northern Africa | 71.3 /100 | #155 | Good 5.2% |
| Immigrants | Kazakhstan | 70.4 /100 | #156 | Good 5.2% |
| Sri Lankans | 69.5 /100 | #157 | Good 5.2% |
| Immigrants | Egypt | 66.7 /100 | #158 | Good 5.2% |
| Immigrants | Russia | 66.6 /100 | #159 | Good 5.2% |
| Laotians | 66.3 /100 | #160 | Good 5.2% |
| Immigrants | Oceania | 65.2 /100 | #161 | Good 5.2% |
| Spanish | 65.1 /100 | #162 | Good 5.2% |
| Immigrants | Zaire | 64.7 /100 | #163 | Good 5.2% |
| Immigrants | Colombia | 64.7 /100 | #164 | Good 5.2% |
| Immigrants | Brazil | 63.1 /100 | #165 | Good 5.2% |
| Immigrants | Indonesia | 61.2 /100 | #166 | Good 5.2% |
| Colombians | 61.1 /100 | #167 | Good 5.2% |
| Uruguayans | 60.2 /100 | #168 | Good 5.2% |
| Immigrants | Morocco | 59.1 /100 | #169 | Average 5.2% |
| Immigrants | Nicaragua | 57.1 /100 | #170 | Average 5.2% |
| Puget Sound Salish | 56.6 /100 | #171 | Average 5.2% |
| Immigrants | Vietnam | 52.5 /100 | #172 | Average 5.2% |
| Immigrants | Poland | 51.8 /100 | #173 | Average 5.3% |
| Immigrants | Congo | 50.0 /100 | #174 | Average 5.3% |