Immigrants from Northern Africa vs Dutch Unemployment
COMPARE
Immigrants from Northern Africa
Dutch
Unemployment
Unemployment Comparison
Immigrants from Northern Africa
Dutch
5.2%
UNEMPLOYMENT
71.3/ 100
METRIC RATING
155th/ 347
METRIC RANK
4.6%
UNEMPLOYMENT
100.0/ 100
METRIC RATING
10th/ 347
METRIC RANK
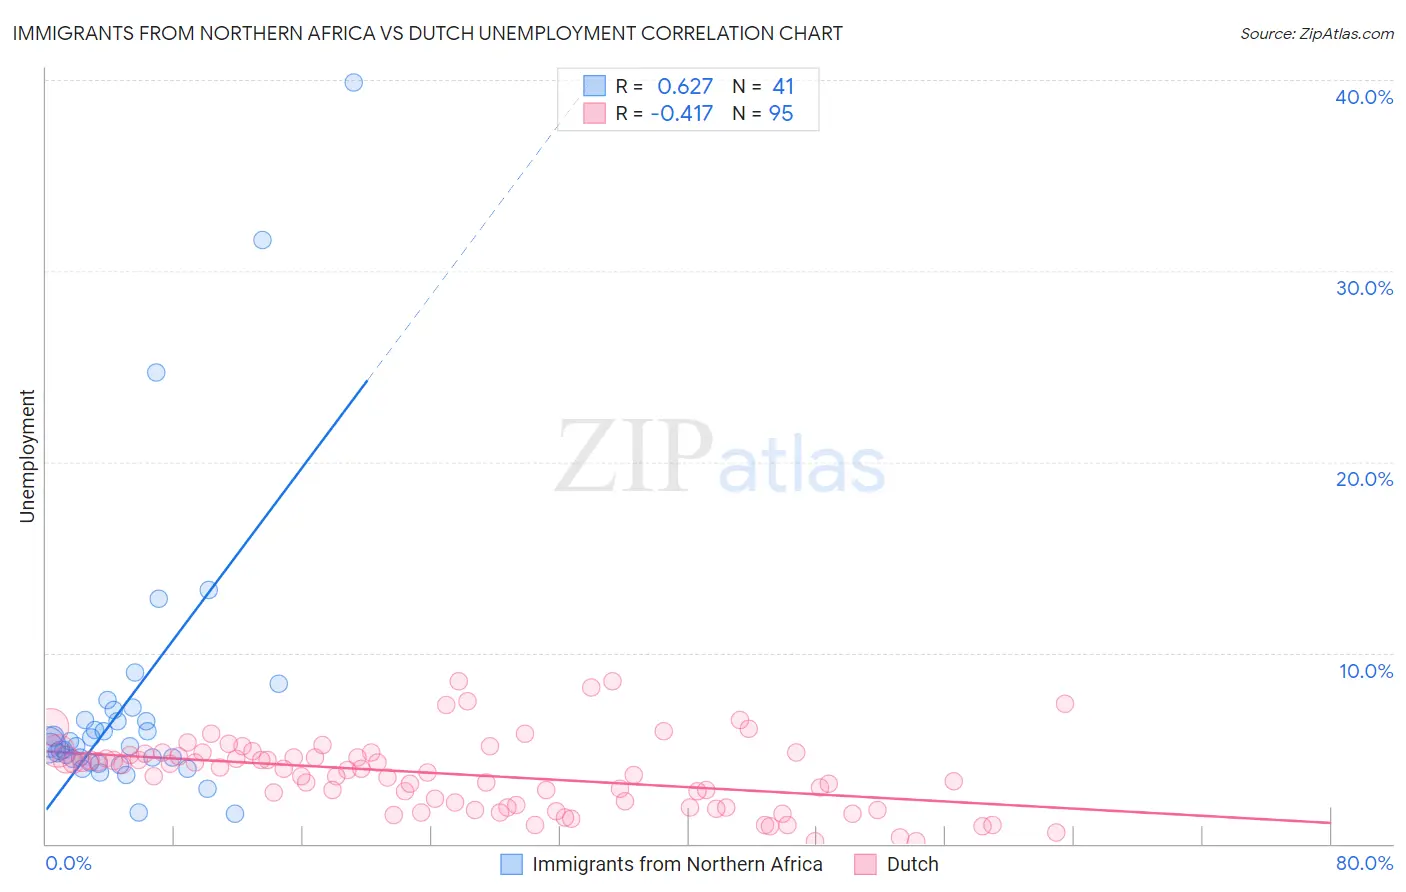
Immigrants from Northern Africa vs Dutch Unemployment Correlation Chart
The statistical analysis conducted on geographies consisting of 321,091,849 people shows a significant positive correlation between the proportion of Immigrants from Northern Africa and unemployment in the United States with a correlation coefficient (R) of 0.627 and weighted average of 5.2%. Similarly, the statistical analysis conducted on geographies consisting of 551,058,238 people shows a moderate negative correlation between the proportion of Dutch and unemployment in the United States with a correlation coefficient (R) of -0.417 and weighted average of 4.6%, a difference of 13.4%.
Unemployment Correlation Summary
| Measurement | Immigrants from Northern Africa | Dutch |
| Minimum | 1.6% | 0.10% |
| Maximum | 39.9% | 8.5% |
| Range | 38.3% | 8.4% |
| Mean | 7.5% | 3.6% |
| Median | 5.2% | 3.8% |
| Interquartile 25% (IQ1) | 4.4% | 1.9% |
| Interquartile 75% (IQ3) | 6.7% | 4.7% |
| Interquartile Range (IQR) | 2.4% | 2.8% |
| Standard Deviation (Sample) | 7.5% | 1.9% |
| Standard Deviation (Population) | 7.5% | 1.9% |
Similar Demographics by Unemployment
Demographics Similar to Immigrants from Northern Africa by Unemployment
In terms of unemployment, the demographic groups most similar to Immigrants from Northern Africa are Immigrants from Kazakhstan (5.2%, a difference of 0.070%), Sri Lankan (5.2%, a difference of 0.13%), Immigrants from China (5.2%, a difference of 0.28%), Immigrants from Eastern Europe (5.2%, a difference of 0.32%), and Immigrants from Hong Kong (5.2%, a difference of 0.32%).
| Demographics | Rating | Rank | Unemployment |
| Immigrants | Italy | 79.1 /100 | #148 | Good 5.1% |
| Syrians | 77.7 /100 | #149 | Good 5.2% |
| Potawatomi | 76.2 /100 | #150 | Good 5.2% |
| Immigrants | Eastern Europe | 75.3 /100 | #151 | Good 5.2% |
| Immigrants | Hong Kong | 75.2 /100 | #152 | Good 5.2% |
| Egyptians | 75.2 /100 | #153 | Good 5.2% |
| Immigrants | China | 74.7 /100 | #154 | Good 5.2% |
| Immigrants | Northern Africa | 71.3 /100 | #155 | Good 5.2% |
| Immigrants | Kazakhstan | 70.4 /100 | #156 | Good 5.2% |
| Sri Lankans | 69.5 /100 | #157 | Good 5.2% |
| Immigrants | Egypt | 66.7 /100 | #158 | Good 5.2% |
| Immigrants | Russia | 66.6 /100 | #159 | Good 5.2% |
| Laotians | 66.3 /100 | #160 | Good 5.2% |
| Immigrants | Oceania | 65.2 /100 | #161 | Good 5.2% |
| Spanish | 65.1 /100 | #162 | Good 5.2% |
Demographics Similar to Dutch by Unemployment
In terms of unemployment, the demographic groups most similar to Dutch are Scandinavian (4.5%, a difference of 0.51%), English (4.6%, a difference of 0.66%), Pennsylvania German (4.6%, a difference of 0.76%), Swiss (4.5%, a difference of 0.90%), and Belgian (4.6%, a difference of 0.93%).
| Demographics | Rating | Rank | Unemployment |
| Czechs | 100.0 /100 | #3 | Exceptional 4.3% |
| Danes | 100.0 /100 | #4 | Exceptional 4.3% |
| Swedes | 100.0 /100 | #5 | Exceptional 4.4% |
| Germans | 100.0 /100 | #6 | Exceptional 4.5% |
| Immigrants | India | 100.0 /100 | #7 | Exceptional 4.5% |
| Swiss | 100.0 /100 | #8 | Exceptional 4.5% |
| Scandinavians | 100.0 /100 | #9 | Exceptional 4.5% |
| Dutch | 100.0 /100 | #10 | Exceptional 4.6% |
| English | 100.0 /100 | #11 | Exceptional 4.6% |
| Pennsylvania Germans | 100.0 /100 | #12 | Exceptional 4.6% |
| Belgians | 100.0 /100 | #13 | Exceptional 4.6% |
| Immigrants | Cuba | 100.0 /100 | #14 | Exceptional 4.6% |
| Europeans | 99.9 /100 | #15 | Exceptional 4.6% |
| Chinese | 99.9 /100 | #16 | Exceptional 4.7% |
| Slovenes | 99.9 /100 | #17 | Exceptional 4.7% |