Immigrants from Nigeria vs Immigrants from Mexico Single Mother Households
COMPARE
Immigrants from Nigeria
Immigrants from Mexico
Single Mother Households
Single Mother Households Comparison
Immigrants from Nigeria
Immigrants from Mexico
7.8%
SINGLE MOTHER HOUSEHOLDS
0.0/ 100
METRIC RATING
290th/ 347
METRIC RANK
8.2%
SINGLE MOTHER HOUSEHOLDS
0.0/ 100
METRIC RATING
314th/ 347
METRIC RANK
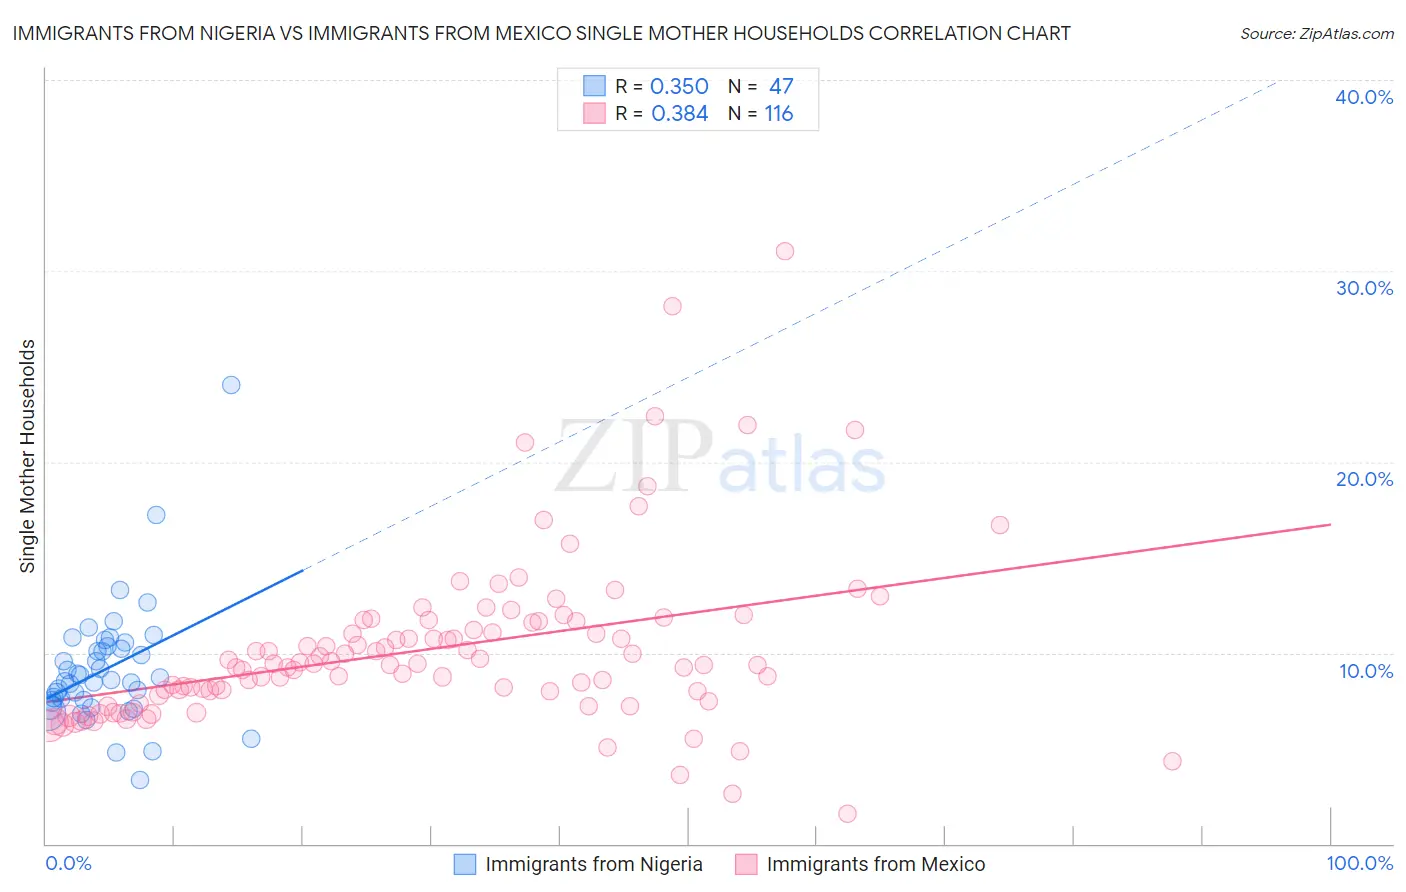
Immigrants from Nigeria vs Immigrants from Mexico Single Mother Households Correlation Chart
The statistical analysis conducted on geographies consisting of 283,117,346 people shows a mild positive correlation between the proportion of Immigrants from Nigeria and percentage of single mother households in the United States with a correlation coefficient (R) of 0.350 and weighted average of 7.8%. Similarly, the statistical analysis conducted on geographies consisting of 511,292,924 people shows a mild positive correlation between the proportion of Immigrants from Mexico and percentage of single mother households in the United States with a correlation coefficient (R) of 0.384 and weighted average of 8.2%, a difference of 4.1%.
Single Mother Households Correlation Summary
| Measurement | Immigrants from Nigeria | Immigrants from Mexico |
| Minimum | 3.3% | 1.6% |
| Maximum | 24.0% | 31.0% |
| Range | 20.7% | 29.5% |
| Mean | 9.1% | 10.2% |
| Median | 8.6% | 9.4% |
| Interquartile 25% (IQ1) | 7.4% | 7.9% |
| Interquartile 75% (IQ3) | 10.4% | 11.6% |
| Interquartile Range (IQR) | 2.9% | 3.7% |
| Standard Deviation (Sample) | 3.2% | 4.5% |
| Standard Deviation (Population) | 3.2% | 4.4% |
Similar Demographics by Single Mother Households
Demographics Similar to Immigrants from Nigeria by Single Mother Households
In terms of single mother households, the demographic groups most similar to Immigrants from Nigeria are West Indian (7.8%, a difference of 0.080%), Ghanaian (7.8%, a difference of 0.090%), Subsaharan African (7.8%, a difference of 0.42%), Immigrants from Cameroon (7.9%, a difference of 0.45%), and Apache (7.9%, a difference of 0.55%).
| Demographics | Rating | Rank | Single Mother Households |
| Nigerians | 0.0 /100 | #283 | Tragic 7.7% |
| Immigrants | Belize | 0.0 /100 | #284 | Tragic 7.7% |
| Trinidadians and Tobagonians | 0.0 /100 | #285 | Tragic 7.7% |
| Immigrants | Middle Africa | 0.0 /100 | #286 | Tragic 7.7% |
| Immigrants | Guatemala | 0.0 /100 | #287 | Tragic 7.7% |
| Sierra Leoneans | 0.0 /100 | #288 | Tragic 7.7% |
| Sub-Saharan Africans | 0.0 /100 | #289 | Tragic 7.8% |
| Immigrants | Nigeria | 0.0 /100 | #290 | Tragic 7.8% |
| West Indians | 0.0 /100 | #291 | Tragic 7.8% |
| Ghanaians | 0.0 /100 | #292 | Tragic 7.8% |
| Immigrants | Cameroon | 0.0 /100 | #293 | Tragic 7.9% |
| Apache | 0.0 /100 | #294 | Tragic 7.9% |
| Barbadians | 0.0 /100 | #295 | Tragic 7.9% |
| Immigrants | Latin America | 0.0 /100 | #296 | Tragic 7.9% |
| Hispanics or Latinos | 0.0 /100 | #297 | Tragic 7.9% |
Demographics Similar to Immigrants from Mexico by Single Mother Households
In terms of single mother households, the demographic groups most similar to Immigrants from Mexico are Immigrants from Western Africa (8.2%, a difference of 0.030%), Immigrants from Grenada (8.2%, a difference of 0.12%), African (8.2%, a difference of 0.17%), Bangladeshi (8.1%, a difference of 0.28%), and Immigrants from Honduras (8.2%, a difference of 0.31%).
| Demographics | Rating | Rank | Single Mother Households |
| Immigrants | St. Vincent and the Grenadines | 0.0 /100 | #307 | Tragic 8.0% |
| Immigrants | Central America | 0.0 /100 | #308 | Tragic 8.1% |
| Cheyenne | 0.0 /100 | #309 | Tragic 8.1% |
| Hondurans | 0.0 /100 | #310 | Tragic 8.1% |
| Immigrants | Congo | 0.0 /100 | #311 | Tragic 8.1% |
| Bangladeshis | 0.0 /100 | #312 | Tragic 8.1% |
| Immigrants | Grenada | 0.0 /100 | #313 | Tragic 8.2% |
| Immigrants | Mexico | 0.0 /100 | #314 | Tragic 8.2% |
| Immigrants | Western Africa | 0.0 /100 | #315 | Tragic 8.2% |
| Africans | 0.0 /100 | #316 | Tragic 8.2% |
| Immigrants | Honduras | 0.0 /100 | #317 | Tragic 8.2% |
| Senegalese | 0.0 /100 | #318 | Tragic 8.2% |
| Jamaicans | 0.0 /100 | #319 | Tragic 8.2% |
| Bahamians | 0.0 /100 | #320 | Tragic 8.3% |
| Immigrants | Senegal | 0.0 /100 | #321 | Tragic 8.3% |