Puerto Rican vs Brazilian Unemployment
COMPARE
Puerto Rican
Brazilian
Unemployment
Unemployment Comparison
Puerto Ricans
Brazilians
8.4%
UNEMPLOYMENT
0.0/ 100
METRIC RATING
340th/ 347
METRIC RANK
5.3%
UNEMPLOYMENT
40.2/ 100
METRIC RATING
183rd/ 347
METRIC RANK
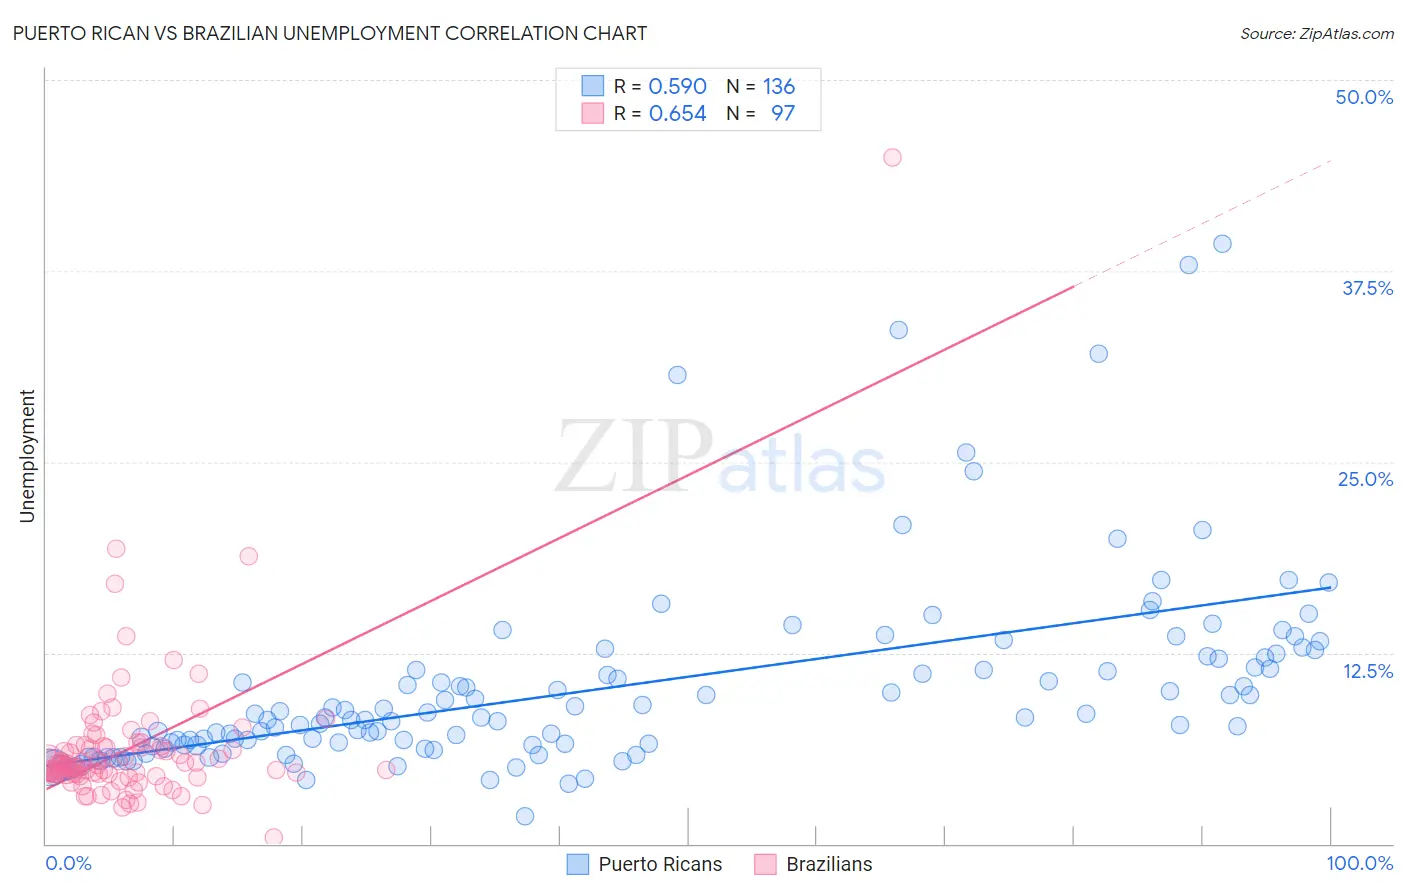
Puerto Rican vs Brazilian Unemployment Correlation Chart
The statistical analysis conducted on geographies consisting of 526,845,718 people shows a substantial positive correlation between the proportion of Puerto Ricans and unemployment in the United States with a correlation coefficient (R) of 0.590 and weighted average of 8.4%. Similarly, the statistical analysis conducted on geographies consisting of 323,781,873 people shows a significant positive correlation between the proportion of Brazilians and unemployment in the United States with a correlation coefficient (R) of 0.654 and weighted average of 5.3%, a difference of 59.1%.
Unemployment Correlation Summary
| Measurement | Puerto Rican | Brazilian |
| Minimum | 1.8% | 0.40% |
| Maximum | 39.3% | 44.9% |
| Range | 37.5% | 44.5% |
| Mean | 10.2% | 6.3% |
| Median | 8.3% | 5.2% |
| Interquartile 25% (IQ1) | 6.4% | 4.5% |
| Interquartile 75% (IQ3) | 11.8% | 6.4% |
| Interquartile Range (IQR) | 5.4% | 1.9% |
| Standard Deviation (Sample) | 6.3% | 5.0% |
| Standard Deviation (Population) | 6.3% | 5.0% |
Similar Demographics by Unemployment
Demographics Similar to Puerto Ricans by Unemployment
In terms of unemployment, the demographic groups most similar to Puerto Ricans are Navajo (8.4%, a difference of 0.79%), Pima (8.2%, a difference of 2.4%), Cheyenne (8.0%, a difference of 5.2%), Tohono O'odham (8.9%, a difference of 5.4%), and Hopi (8.9%, a difference of 5.9%).
| Demographics | Rating | Rank | Unemployment |
| Immigrants | Dominican Republic | 0.0 /100 | #333 | Tragic 7.4% |
| Apache | 0.0 /100 | #334 | Tragic 7.4% |
| Alaskan Athabascans | 0.0 /100 | #335 | Tragic 7.7% |
| Immigrants | Yemen | 0.0 /100 | #336 | Tragic 7.7% |
| Cheyenne | 0.0 /100 | #337 | Tragic 8.0% |
| Pima | 0.0 /100 | #338 | Tragic 8.2% |
| Navajo | 0.0 /100 | #339 | Tragic 8.4% |
| Puerto Ricans | 0.0 /100 | #340 | Tragic 8.4% |
| Tohono O'odham | 0.0 /100 | #341 | Tragic 8.9% |
| Hopi | 0.0 /100 | #342 | Tragic 8.9% |
| Yuman | 0.0 /100 | #343 | Tragic 9.1% |
| Arapaho | 0.0 /100 | #344 | Tragic 9.8% |
| Inupiat | 0.0 /100 | #345 | Tragic 10.1% |
| Crow | 0.0 /100 | #346 | Tragic 11.1% |
| Yup'ik | 0.0 /100 | #347 | Tragic 13.6% |
Demographics Similar to Brazilians by Unemployment
In terms of unemployment, the demographic groups most similar to Brazilians are Assyrian/Chaldean/Syriac (5.3%, a difference of 0.060%), Immigrants from Thailand (5.3%, a difference of 0.080%), Spaniard (5.3%, a difference of 0.13%), Immigrants from Uganda (5.3%, a difference of 0.15%), and Costa Rican (5.3%, a difference of 0.18%).
| Demographics | Rating | Rank | Unemployment |
| Nicaraguans | 48.7 /100 | #176 | Average 5.3% |
| Immigrants | Nonimmigrants | 47.9 /100 | #177 | Average 5.3% |
| Afghans | 47.4 /100 | #178 | Average 5.3% |
| Malaysians | 46.8 /100 | #179 | Average 5.3% |
| Immigrants | Greece | 45.0 /100 | #180 | Average 5.3% |
| Albanians | 43.5 /100 | #181 | Average 5.3% |
| Spaniards | 42.2 /100 | #182 | Average 5.3% |
| Brazilians | 40.2 /100 | #183 | Average 5.3% |
| Assyrians/Chaldeans/Syriacs | 39.2 /100 | #184 | Fair 5.3% |
| Immigrants | Thailand | 38.9 /100 | #185 | Fair 5.3% |
| Immigrants | Uganda | 37.8 /100 | #186 | Fair 5.3% |
| Costa Ricans | 37.4 /100 | #187 | Fair 5.3% |
| Alsatians | 37.0 /100 | #188 | Fair 5.3% |
| Immigrants | Belarus | 35.6 /100 | #189 | Fair 5.3% |
| Arabs | 35.3 /100 | #190 | Fair 5.3% |