Palestinian vs Brazilian Unemployment
COMPARE
Palestinian
Brazilian
Unemployment
Unemployment Comparison
Palestinians
Brazilians
5.1%
UNEMPLOYMENT
83.4/ 100
METRIC RATING
141st/ 347
METRIC RANK
5.3%
UNEMPLOYMENT
40.2/ 100
METRIC RATING
183rd/ 347
METRIC RANK
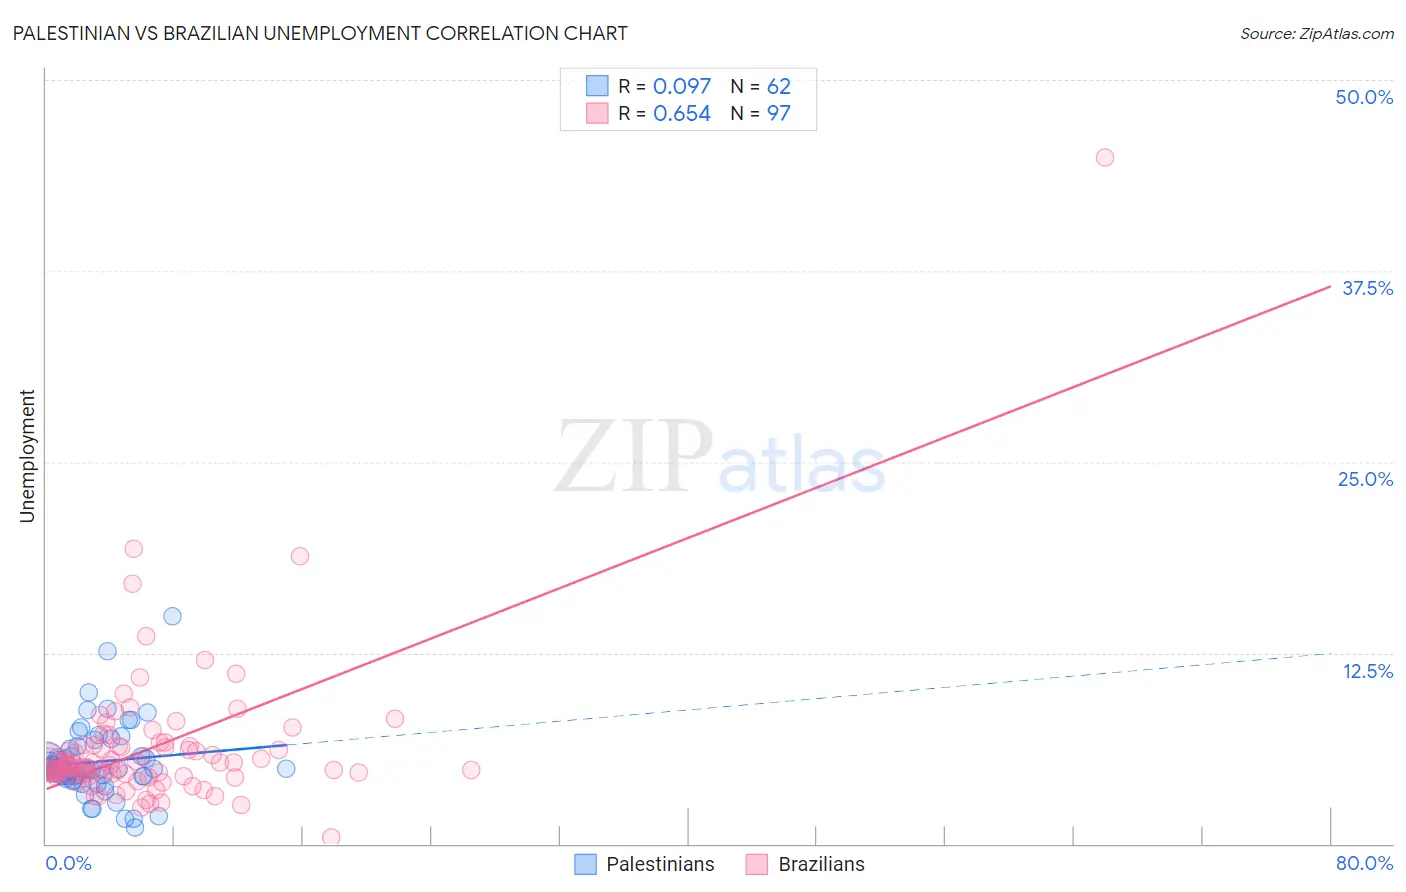
Palestinian vs Brazilian Unemployment Correlation Chart
The statistical analysis conducted on geographies consisting of 216,422,149 people shows a slight positive correlation between the proportion of Palestinians and unemployment in the United States with a correlation coefficient (R) of 0.097 and weighted average of 5.1%. Similarly, the statistical analysis conducted on geographies consisting of 323,781,873 people shows a significant positive correlation between the proportion of Brazilians and unemployment in the United States with a correlation coefficient (R) of 0.654 and weighted average of 5.3%, a difference of 3.2%.
Unemployment Correlation Summary
| Measurement | Palestinian | Brazilian |
| Minimum | 1.1% | 0.40% |
| Maximum | 14.9% | 44.9% |
| Range | 13.8% | 44.5% |
| Mean | 5.4% | 6.3% |
| Median | 4.9% | 5.2% |
| Interquartile 25% (IQ1) | 4.4% | 4.5% |
| Interquartile 75% (IQ3) | 6.2% | 6.4% |
| Interquartile Range (IQR) | 1.8% | 1.9% |
| Standard Deviation (Sample) | 2.4% | 5.0% |
| Standard Deviation (Population) | 2.4% | 5.0% |
Similar Demographics by Unemployment
Demographics Similar to Palestinians by Unemployment
In terms of unemployment, the demographic groups most similar to Palestinians are Immigrants from Pakistan (5.1%, a difference of 0.020%), Immigrants from Chile (5.1%, a difference of 0.070%), Immigrants from Denmark (5.1%, a difference of 0.11%), Indonesian (5.1%, a difference of 0.12%), and Immigrants from Norway (5.1%, a difference of 0.17%).
| Demographics | Rating | Rank | Unemployment |
| Immigrants | Europe | 86.3 /100 | #134 | Excellent 5.1% |
| Immigrants | Burma/Myanmar | 86.2 /100 | #135 | Excellent 5.1% |
| Immigrants | Spain | 86.2 /100 | #136 | Excellent 5.1% |
| Immigrants | Saudi Arabia | 85.6 /100 | #137 | Excellent 5.1% |
| Immigrants | Hungary | 85.6 /100 | #138 | Excellent 5.1% |
| Pakistanis | 85.3 /100 | #139 | Excellent 5.1% |
| Immigrants | Denmark | 84.3 /100 | #140 | Excellent 5.1% |
| Palestinians | 83.4 /100 | #141 | Excellent 5.1% |
| Immigrants | Pakistan | 83.2 /100 | #142 | Excellent 5.1% |
| Immigrants | Chile | 82.8 /100 | #143 | Excellent 5.1% |
| Indonesians | 82.3 /100 | #144 | Excellent 5.1% |
| Immigrants | Norway | 81.8 /100 | #145 | Excellent 5.1% |
| Immigrants | Asia | 81.8 /100 | #146 | Excellent 5.1% |
| Indians (Asian) | 81.6 /100 | #147 | Excellent 5.1% |
| Immigrants | Italy | 79.1 /100 | #148 | Good 5.1% |
Demographics Similar to Brazilians by Unemployment
In terms of unemployment, the demographic groups most similar to Brazilians are Assyrian/Chaldean/Syriac (5.3%, a difference of 0.060%), Immigrants from Thailand (5.3%, a difference of 0.080%), Spaniard (5.3%, a difference of 0.13%), Immigrants from Uganda (5.3%, a difference of 0.15%), and Costa Rican (5.3%, a difference of 0.18%).
| Demographics | Rating | Rank | Unemployment |
| Nicaraguans | 48.7 /100 | #176 | Average 5.3% |
| Immigrants | Nonimmigrants | 47.9 /100 | #177 | Average 5.3% |
| Afghans | 47.4 /100 | #178 | Average 5.3% |
| Malaysians | 46.8 /100 | #179 | Average 5.3% |
| Immigrants | Greece | 45.0 /100 | #180 | Average 5.3% |
| Albanians | 43.5 /100 | #181 | Average 5.3% |
| Spaniards | 42.2 /100 | #182 | Average 5.3% |
| Brazilians | 40.2 /100 | #183 | Average 5.3% |
| Assyrians/Chaldeans/Syriacs | 39.2 /100 | #184 | Fair 5.3% |
| Immigrants | Thailand | 38.9 /100 | #185 | Fair 5.3% |
| Immigrants | Uganda | 37.8 /100 | #186 | Fair 5.3% |
| Costa Ricans | 37.4 /100 | #187 | Fair 5.3% |
| Alsatians | 37.0 /100 | #188 | Fair 5.3% |
| Immigrants | Belarus | 35.6 /100 | #189 | Fair 5.3% |
| Arabs | 35.3 /100 | #190 | Fair 5.3% |