Immigrants from Nepal vs Jamaican Male Unemployment
COMPARE
Immigrants from Nepal
Jamaican
Male Unemployment
Male Unemployment Comparison
Immigrants from Nepal
Jamaicans
4.8%
MALE UNEMPLOYMENT
99.8/ 100
METRIC RATING
32nd/ 347
METRIC RANK
6.6%
MALE UNEMPLOYMENT
0.0/ 100
METRIC RATING
298th/ 347
METRIC RANK
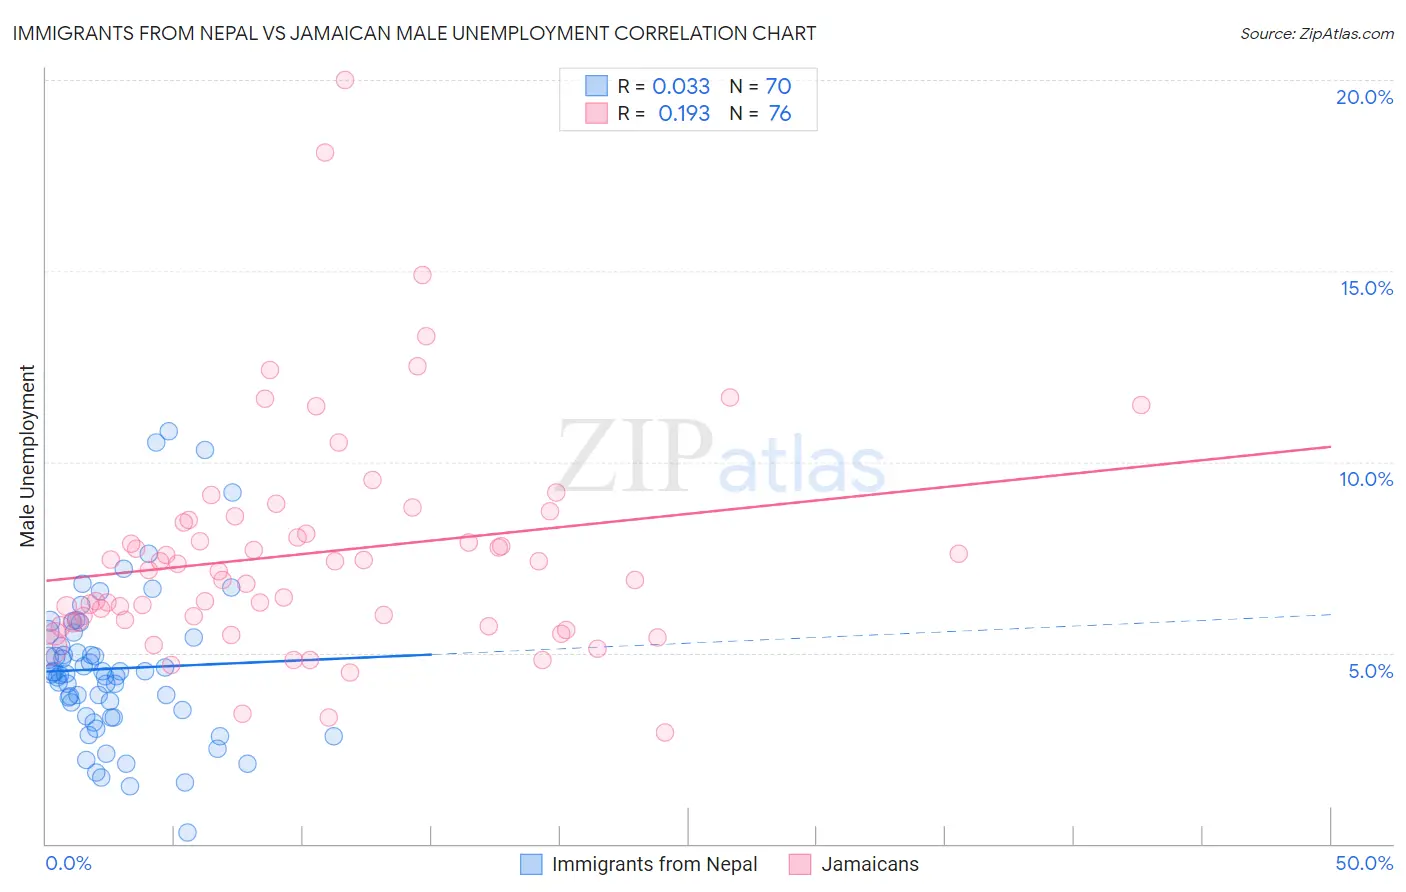
Immigrants from Nepal vs Jamaican Male Unemployment Correlation Chart
The statistical analysis conducted on geographies consisting of 186,501,953 people shows no correlation between the proportion of Immigrants from Nepal and unemployment rate among males in the United States with a correlation coefficient (R) of 0.033 and weighted average of 4.8%. Similarly, the statistical analysis conducted on geographies consisting of 366,759,290 people shows a poor positive correlation between the proportion of Jamaicans and unemployment rate among males in the United States with a correlation coefficient (R) of 0.193 and weighted average of 6.6%, a difference of 35.7%.
Male Unemployment Correlation Summary
| Measurement | Immigrants from Nepal | Jamaican |
| Minimum | 0.30% | 2.9% |
| Maximum | 10.8% | 20.0% |
| Range | 10.5% | 17.1% |
| Mean | 4.6% | 7.6% |
| Median | 4.5% | 7.2% |
| Interquartile 25% (IQ1) | 3.4% | 5.8% |
| Interquartile 75% (IQ3) | 5.4% | 8.4% |
| Interquartile Range (IQR) | 2.0% | 2.6% |
| Standard Deviation (Sample) | 2.0% | 3.0% |
| Standard Deviation (Population) | 2.0% | 3.0% |
Similar Demographics by Male Unemployment
Demographics Similar to Immigrants from Nepal by Male Unemployment
In terms of male unemployment, the demographic groups most similar to Immigrants from Nepal are Sudanese (4.8%, a difference of 0.010%), British (4.8%, a difference of 0.26%), Latvian (4.8%, a difference of 0.30%), Welsh (4.8%, a difference of 0.38%), and Scottish (4.8%, a difference of 0.57%).
| Demographics | Rating | Rank | Male Unemployment |
| Zimbabweans | 99.9 /100 | #25 | Exceptional 4.8% |
| Dutch | 99.9 /100 | #26 | Exceptional 4.8% |
| Belgians | 99.9 /100 | #27 | Exceptional 4.8% |
| Bulgarians | 99.8 /100 | #28 | Exceptional 4.8% |
| Scottish | 99.8 /100 | #29 | Exceptional 4.8% |
| British | 99.8 /100 | #30 | Exceptional 4.8% |
| Sudanese | 99.8 /100 | #31 | Exceptional 4.8% |
| Immigrants | Nepal | 99.8 /100 | #32 | Exceptional 4.8% |
| Latvians | 99.7 /100 | #33 | Exceptional 4.8% |
| Welsh | 99.7 /100 | #34 | Exceptional 4.8% |
| Paraguayans | 99.5 /100 | #35 | Exceptional 4.9% |
| Immigrants | Singapore | 99.4 /100 | #36 | Exceptional 4.9% |
| Scotch-Irish | 99.4 /100 | #37 | Exceptional 4.9% |
| Immigrants | Bosnia and Herzegovina | 99.4 /100 | #38 | Exceptional 4.9% |
| Burmese | 99.3 /100 | #39 | Exceptional 4.9% |
Demographics Similar to Jamaicans by Male Unemployment
In terms of male unemployment, the demographic groups most similar to Jamaicans are Chippewa (6.6%, a difference of 0.080%), Immigrants from Bangladesh (6.6%, a difference of 0.13%), Immigrants from Haiti (6.5%, a difference of 0.40%), Vietnamese (6.6%, a difference of 0.40%), and Immigrants from Belize (6.6%, a difference of 0.51%).
| Demographics | Rating | Rank | Male Unemployment |
| Immigrants | Azores | 0.0 /100 | #291 | Tragic 6.4% |
| Nepalese | 0.0 /100 | #292 | Tragic 6.4% |
| Haitians | 0.0 /100 | #293 | Tragic 6.4% |
| Senegalese | 0.0 /100 | #294 | Tragic 6.4% |
| Belizeans | 0.0 /100 | #295 | Tragic 6.5% |
| Immigrants | Haiti | 0.0 /100 | #296 | Tragic 6.5% |
| Chippewa | 0.0 /100 | #297 | Tragic 6.6% |
| Jamaicans | 0.0 /100 | #298 | Tragic 6.6% |
| Immigrants | Bangladesh | 0.0 /100 | #299 | Tragic 6.6% |
| Vietnamese | 0.0 /100 | #300 | Tragic 6.6% |
| Immigrants | Belize | 0.0 /100 | #301 | Tragic 6.6% |
| Ute | 0.0 /100 | #302 | Tragic 6.6% |
| Immigrants | West Indies | 0.0 /100 | #303 | Tragic 6.7% |
| West Indians | 0.0 /100 | #304 | Tragic 6.7% |
| Trinidadians and Tobagonians | 0.0 /100 | #305 | Tragic 6.7% |