Colville vs Jamaican Male Unemployment
COMPARE
Colville
Jamaican
Male Unemployment
Male Unemployment Comparison
Colville
Jamaicans
7.4%
MALE UNEMPLOYMENT
0.0/ 100
METRIC RATING
320th/ 347
METRIC RANK
6.6%
MALE UNEMPLOYMENT
0.0/ 100
METRIC RATING
298th/ 347
METRIC RANK
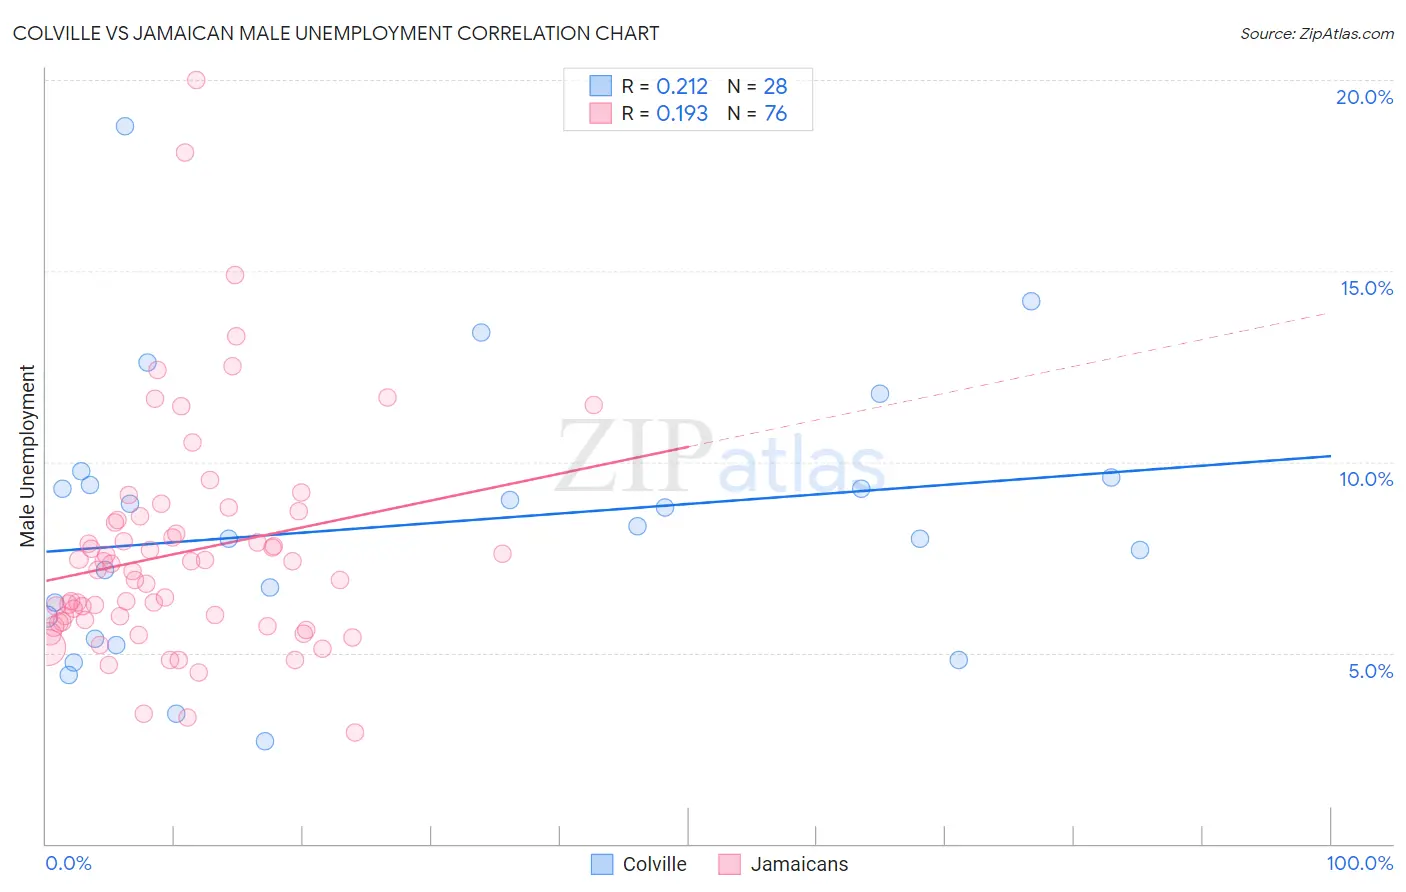
Colville vs Jamaican Male Unemployment Correlation Chart
The statistical analysis conducted on geographies consisting of 34,671,392 people shows a weak positive correlation between the proportion of Colville and unemployment rate among males in the United States with a correlation coefficient (R) of 0.212 and weighted average of 7.4%. Similarly, the statistical analysis conducted on geographies consisting of 366,759,290 people shows a poor positive correlation between the proportion of Jamaicans and unemployment rate among males in the United States with a correlation coefficient (R) of 0.193 and weighted average of 6.6%, a difference of 12.4%.
Male Unemployment Correlation Summary
| Measurement | Colville | Jamaican |
| Minimum | 2.7% | 2.9% |
| Maximum | 18.8% | 20.0% |
| Range | 16.1% | 17.1% |
| Mean | 8.3% | 7.6% |
| Median | 8.2% | 7.2% |
| Interquartile 25% (IQ1) | 5.7% | 5.8% |
| Interquartile 75% (IQ3) | 9.5% | 8.4% |
| Interquartile Range (IQR) | 3.8% | 2.6% |
| Standard Deviation (Sample) | 3.5% | 3.0% |
| Standard Deviation (Population) | 3.5% | 3.0% |
Similar Demographics by Male Unemployment
Demographics Similar to Colville by Male Unemployment
In terms of male unemployment, the demographic groups most similar to Colville are British West Indian (7.3%, a difference of 0.90%), Immigrants from St. Vincent and the Grenadines (7.5%, a difference of 1.4%), Immigrants from Cabo Verde (7.5%, a difference of 1.7%), Immigrants from Grenada (7.6%, a difference of 2.5%), and Dominican (7.6%, a difference of 2.8%).
| Demographics | Rating | Rank | Male Unemployment |
| Immigrants | Dominica | 0.0 /100 | #313 | Tragic 7.0% |
| Immigrants | Barbados | 0.0 /100 | #314 | Tragic 7.1% |
| Houma | 0.0 /100 | #315 | Tragic 7.1% |
| Immigrants | Guyana | 0.0 /100 | #316 | Tragic 7.1% |
| Guyanese | 0.0 /100 | #317 | Tragic 7.1% |
| Cape Verdeans | 0.0 /100 | #318 | Tragic 7.1% |
| British West Indians | 0.0 /100 | #319 | Tragic 7.3% |
| Colville | 0.0 /100 | #320 | Tragic 7.4% |
| Immigrants | St. Vincent and the Grenadines | 0.0 /100 | #321 | Tragic 7.5% |
| Immigrants | Cabo Verde | 0.0 /100 | #322 | Tragic 7.5% |
| Immigrants | Grenada | 0.0 /100 | #323 | Tragic 7.6% |
| Dominicans | 0.0 /100 | #324 | Tragic 7.6% |
| Shoshone | 0.0 /100 | #325 | Tragic 7.6% |
| Immigrants | Dominican Republic | 0.0 /100 | #326 | Tragic 7.6% |
| Paiute | 0.0 /100 | #327 | Tragic 7.7% |
Demographics Similar to Jamaicans by Male Unemployment
In terms of male unemployment, the demographic groups most similar to Jamaicans are Chippewa (6.6%, a difference of 0.080%), Immigrants from Bangladesh (6.6%, a difference of 0.13%), Immigrants from Haiti (6.5%, a difference of 0.40%), Vietnamese (6.6%, a difference of 0.40%), and Immigrants from Belize (6.6%, a difference of 0.51%).
| Demographics | Rating | Rank | Male Unemployment |
| Immigrants | Azores | 0.0 /100 | #291 | Tragic 6.4% |
| Nepalese | 0.0 /100 | #292 | Tragic 6.4% |
| Haitians | 0.0 /100 | #293 | Tragic 6.4% |
| Senegalese | 0.0 /100 | #294 | Tragic 6.4% |
| Belizeans | 0.0 /100 | #295 | Tragic 6.5% |
| Immigrants | Haiti | 0.0 /100 | #296 | Tragic 6.5% |
| Chippewa | 0.0 /100 | #297 | Tragic 6.6% |
| Jamaicans | 0.0 /100 | #298 | Tragic 6.6% |
| Immigrants | Bangladesh | 0.0 /100 | #299 | Tragic 6.6% |
| Vietnamese | 0.0 /100 | #300 | Tragic 6.6% |
| Immigrants | Belize | 0.0 /100 | #301 | Tragic 6.6% |
| Ute | 0.0 /100 | #302 | Tragic 6.6% |
| Immigrants | West Indies | 0.0 /100 | #303 | Tragic 6.7% |
| West Indians | 0.0 /100 | #304 | Tragic 6.7% |
| Trinidadians and Tobagonians | 0.0 /100 | #305 | Tragic 6.7% |