Immigrants from Nepal vs Northern European Male Unemployment
COMPARE
Immigrants from Nepal
Northern European
Male Unemployment
Male Unemployment Comparison
Immigrants from Nepal
Northern Europeans
4.8%
MALE UNEMPLOYMENT
99.8/ 100
METRIC RATING
32nd/ 347
METRIC RANK
4.9%
MALE UNEMPLOYMENT
99.3/ 100
METRIC RATING
40th/ 347
METRIC RANK
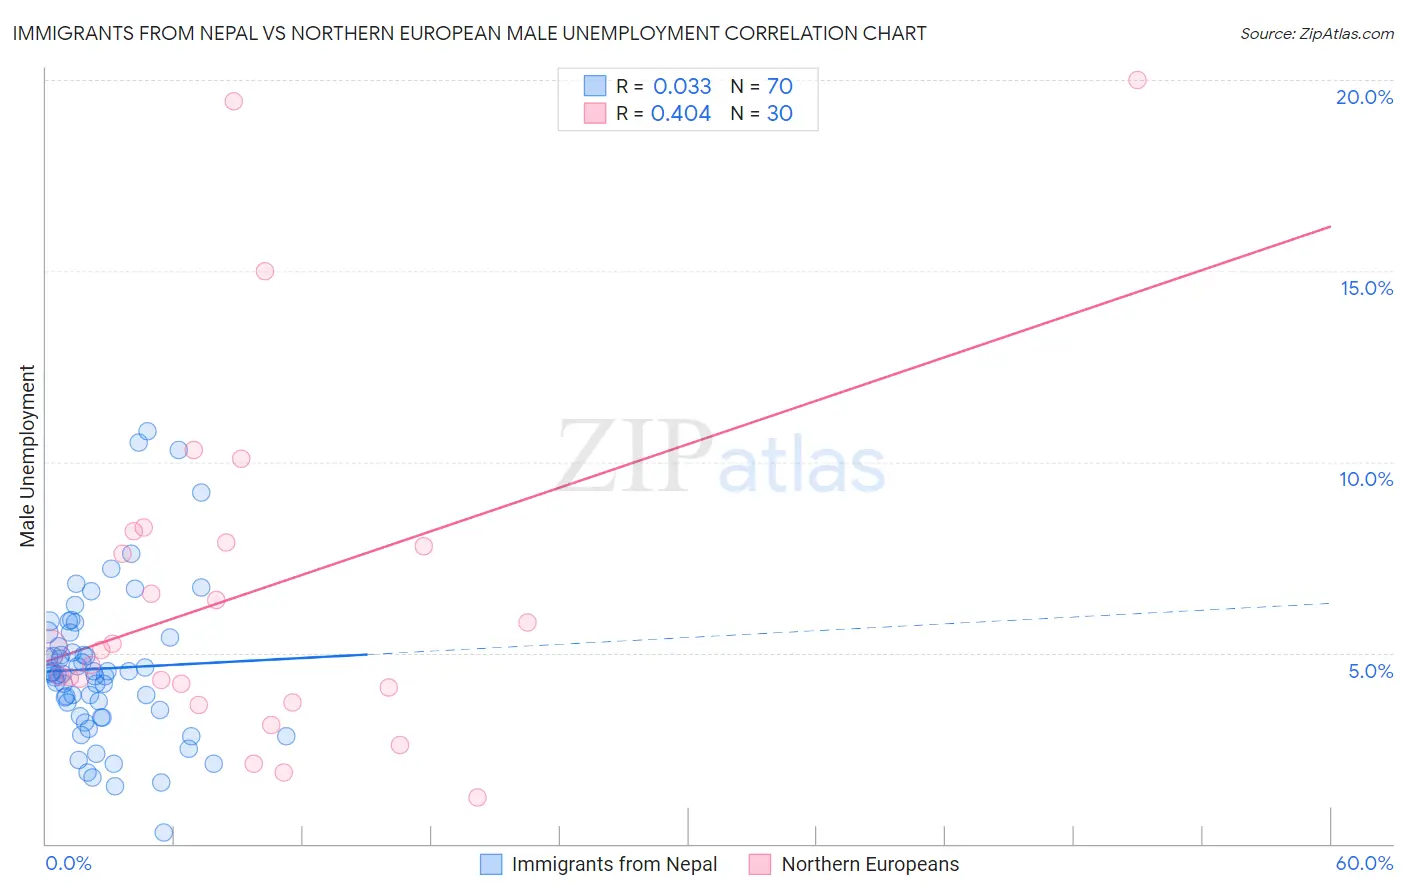
Immigrants from Nepal vs Northern European Male Unemployment Correlation Chart
The statistical analysis conducted on geographies consisting of 186,501,953 people shows no correlation between the proportion of Immigrants from Nepal and unemployment rate among males in the United States with a correlation coefficient (R) of 0.033 and weighted average of 4.8%. Similarly, the statistical analysis conducted on geographies consisting of 403,522,052 people shows a moderate positive correlation between the proportion of Northern Europeans and unemployment rate among males in the United States with a correlation coefficient (R) of 0.404 and weighted average of 4.9%, a difference of 1.7%.
Male Unemployment Correlation Summary
| Measurement | Immigrants from Nepal | Northern European |
| Minimum | 0.30% | 1.2% |
| Maximum | 10.8% | 20.0% |
| Range | 10.5% | 18.8% |
| Mean | 4.6% | 6.6% |
| Median | 4.5% | 5.1% |
| Interquartile 25% (IQ1) | 3.4% | 4.1% |
| Interquartile 75% (IQ3) | 5.4% | 7.9% |
| Interquartile Range (IQR) | 2.0% | 3.8% |
| Standard Deviation (Sample) | 2.0% | 4.6% |
| Standard Deviation (Population) | 2.0% | 4.5% |
Demographics Similar to Immigrants from Nepal and Northern Europeans by Male Unemployment
In terms of male unemployment, the demographic groups most similar to Immigrants from Nepal are Sudanese (4.8%, a difference of 0.010%), British (4.8%, a difference of 0.26%), Latvian (4.8%, a difference of 0.30%), Welsh (4.8%, a difference of 0.38%), and Scottish (4.8%, a difference of 0.57%). Similarly, the demographic groups most similar to Northern Europeans are Burmese (4.9%, a difference of 0.080%), Chinese (4.9%, a difference of 0.080%), Immigrants from Belgium (4.9%, a difference of 0.10%), Immigrants from Bosnia and Herzegovina (4.9%, a difference of 0.15%), and Scotch-Irish (4.9%, a difference of 0.17%).
| Demographics | Rating | Rank | Male Unemployment |
| Dutch | 99.9 /100 | #26 | Exceptional 4.8% |
| Belgians | 99.9 /100 | #27 | Exceptional 4.8% |
| Bulgarians | 99.8 /100 | #28 | Exceptional 4.8% |
| Scottish | 99.8 /100 | #29 | Exceptional 4.8% |
| British | 99.8 /100 | #30 | Exceptional 4.8% |
| Sudanese | 99.8 /100 | #31 | Exceptional 4.8% |
| Immigrants | Nepal | 99.8 /100 | #32 | Exceptional 4.8% |
| Latvians | 99.7 /100 | #33 | Exceptional 4.8% |
| Welsh | 99.7 /100 | #34 | Exceptional 4.8% |
| Paraguayans | 99.5 /100 | #35 | Exceptional 4.9% |
| Immigrants | Singapore | 99.4 /100 | #36 | Exceptional 4.9% |
| Scotch-Irish | 99.4 /100 | #37 | Exceptional 4.9% |
| Immigrants | Bosnia and Herzegovina | 99.4 /100 | #38 | Exceptional 4.9% |
| Burmese | 99.3 /100 | #39 | Exceptional 4.9% |
| Northern Europeans | 99.3 /100 | #40 | Exceptional 4.9% |
| Chinese | 99.3 /100 | #41 | Exceptional 4.9% |
| Immigrants | Belgium | 99.2 /100 | #42 | Exceptional 4.9% |
| Immigrants | Japan | 99.2 /100 | #43 | Exceptional 4.9% |
| Immigrants | Korea | 99.1 /100 | #44 | Exceptional 4.9% |
| Immigrants | Zimbabwe | 99.0 /100 | #45 | Exceptional 4.9% |
| Bhutanese | 98.9 /100 | #46 | Exceptional 4.9% |