Immigrants from Micronesia vs Lebanese Unemployment
COMPARE
Immigrants from Micronesia
Lebanese
Unemployment
Unemployment Comparison
Immigrants from Micronesia
Lebanese
5.3%
UNEMPLOYMENT
25.2/ 100
METRIC RATING
203rd/ 347
METRIC RANK
5.1%
UNEMPLOYMENT
89.2/ 100
METRIC RATING
121st/ 347
METRIC RANK
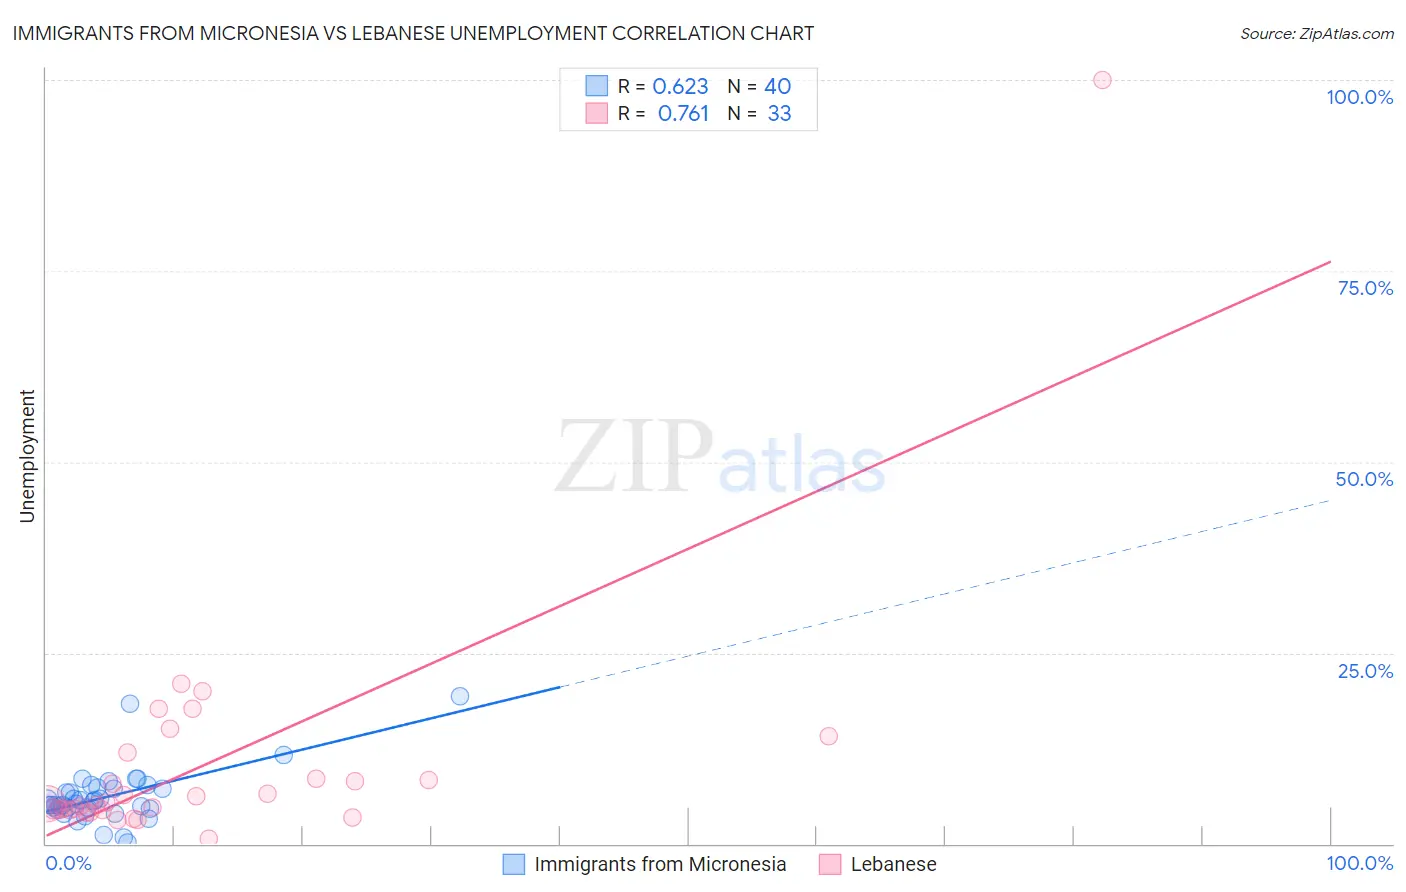
Immigrants from Micronesia vs Lebanese Unemployment Correlation Chart
The statistical analysis conducted on geographies consisting of 61,596,499 people shows a significant positive correlation between the proportion of Immigrants from Micronesia and unemployment in the United States with a correlation coefficient (R) of 0.623 and weighted average of 5.3%. Similarly, the statistical analysis conducted on geographies consisting of 401,244,101 people shows a strong positive correlation between the proportion of Lebanese and unemployment in the United States with a correlation coefficient (R) of 0.761 and weighted average of 5.1%, a difference of 5.1%.
Unemployment Correlation Summary
| Measurement | Immigrants from Micronesia | Lebanese |
| Minimum | 0.10% | 0.70% |
| Maximum | 19.3% | 100.0% |
| Range | 19.2% | 99.3% |
| Mean | 6.2% | 10.4% |
| Median | 5.4% | 5.2% |
| Interquartile 25% (IQ1) | 4.6% | 4.4% |
| Interquartile 75% (IQ3) | 7.3% | 10.2% |
| Interquartile Range (IQR) | 2.6% | 5.8% |
| Standard Deviation (Sample) | 3.7% | 16.9% |
| Standard Deviation (Population) | 3.6% | 16.7% |
Similar Demographics by Unemployment
Demographics Similar to Immigrants from Micronesia by Unemployment
In terms of unemployment, the demographic groups most similar to Immigrants from Micronesia are Cherokee (5.3%, a difference of 0.030%), Immigrants from Ukraine (5.3%, a difference of 0.030%), Native Hawaiian (5.3%, a difference of 0.080%), Immigrants from South Eastern Asia (5.3%, a difference of 0.14%), and Korean (5.3%, a difference of 0.17%).
| Demographics | Rating | Rank | Unemployment |
| Peruvians | 29.9 /100 | #196 | Fair 5.3% |
| Immigrants | Uruguay | 29.8 /100 | #197 | Fair 5.3% |
| Immigrants | Israel | 28.6 /100 | #198 | Fair 5.3% |
| Immigrants | Afghanistan | 28.6 /100 | #199 | Fair 5.3% |
| Koreans | 27.4 /100 | #200 | Fair 5.3% |
| Immigrants | South Eastern Asia | 27.0 /100 | #201 | Fair 5.3% |
| Cherokee | 25.5 /100 | #202 | Fair 5.3% |
| Immigrants | Micronesia | 25.2 /100 | #203 | Fair 5.3% |
| Immigrants | Ukraine | 24.9 /100 | #204 | Fair 5.3% |
| Native Hawaiians | 24.1 /100 | #205 | Fair 5.3% |
| Immigrants | Peru | 22.7 /100 | #206 | Fair 5.4% |
| Creek | 19.4 /100 | #207 | Poor 5.4% |
| Portuguese | 19.0 /100 | #208 | Poor 5.4% |
| Immigrants | Iran | 18.8 /100 | #209 | Poor 5.4% |
| Immigrants | Iraq | 18.6 /100 | #210 | Poor 5.4% |
Demographics Similar to Lebanese by Unemployment
In terms of unemployment, the demographic groups most similar to Lebanese are Immigrants from Switzerland (5.1%, a difference of 0.020%), Asian (5.1%, a difference of 0.040%), Macedonian (5.1%, a difference of 0.070%), Immigrants from France (5.1%, a difference of 0.080%), and Ethiopian (5.1%, a difference of 0.090%).
| Demographics | Rating | Rank | Unemployment |
| Immigrants | Ireland | 92.1 /100 | #114 | Exceptional 5.1% |
| Immigrants | Western Europe | 91.1 /100 | #115 | Exceptional 5.1% |
| Immigrants | Sri Lanka | 91.1 /100 | #116 | Exceptional 5.1% |
| Immigrants | Malaysia | 91.0 /100 | #117 | Exceptional 5.1% |
| Immigrants | Germany | 90.8 /100 | #118 | Exceptional 5.1% |
| Immigrants | France | 89.7 /100 | #119 | Excellent 5.1% |
| Macedonians | 89.7 /100 | #120 | Excellent 5.1% |
| Lebanese | 89.2 /100 | #121 | Excellent 5.1% |
| Immigrants | Switzerland | 89.1 /100 | #122 | Excellent 5.1% |
| Asians | 89.0 /100 | #123 | Excellent 5.1% |
| Ethiopians | 88.6 /100 | #124 | Excellent 5.1% |
| Immigrants | Eastern Asia | 88.3 /100 | #125 | Excellent 5.1% |
| Kenyans | 88.2 /100 | #126 | Excellent 5.1% |
| Immigrants | Kenya | 88.2 /100 | #127 | Excellent 5.1% |
| Immigrants | Eastern Africa | 88.1 /100 | #128 | Excellent 5.1% |