Arapaho vs Immigrants from Zaire Unemployment
COMPARE
Arapaho
Immigrants from Zaire
Unemployment
Unemployment Comparison
Arapaho
Immigrants from Zaire
9.8%
UNEMPLOYMENT
0.0/ 100
METRIC RATING
344th/ 347
METRIC RANK
5.2%
UNEMPLOYMENT
64.7/ 100
METRIC RATING
163rd/ 347
METRIC RANK
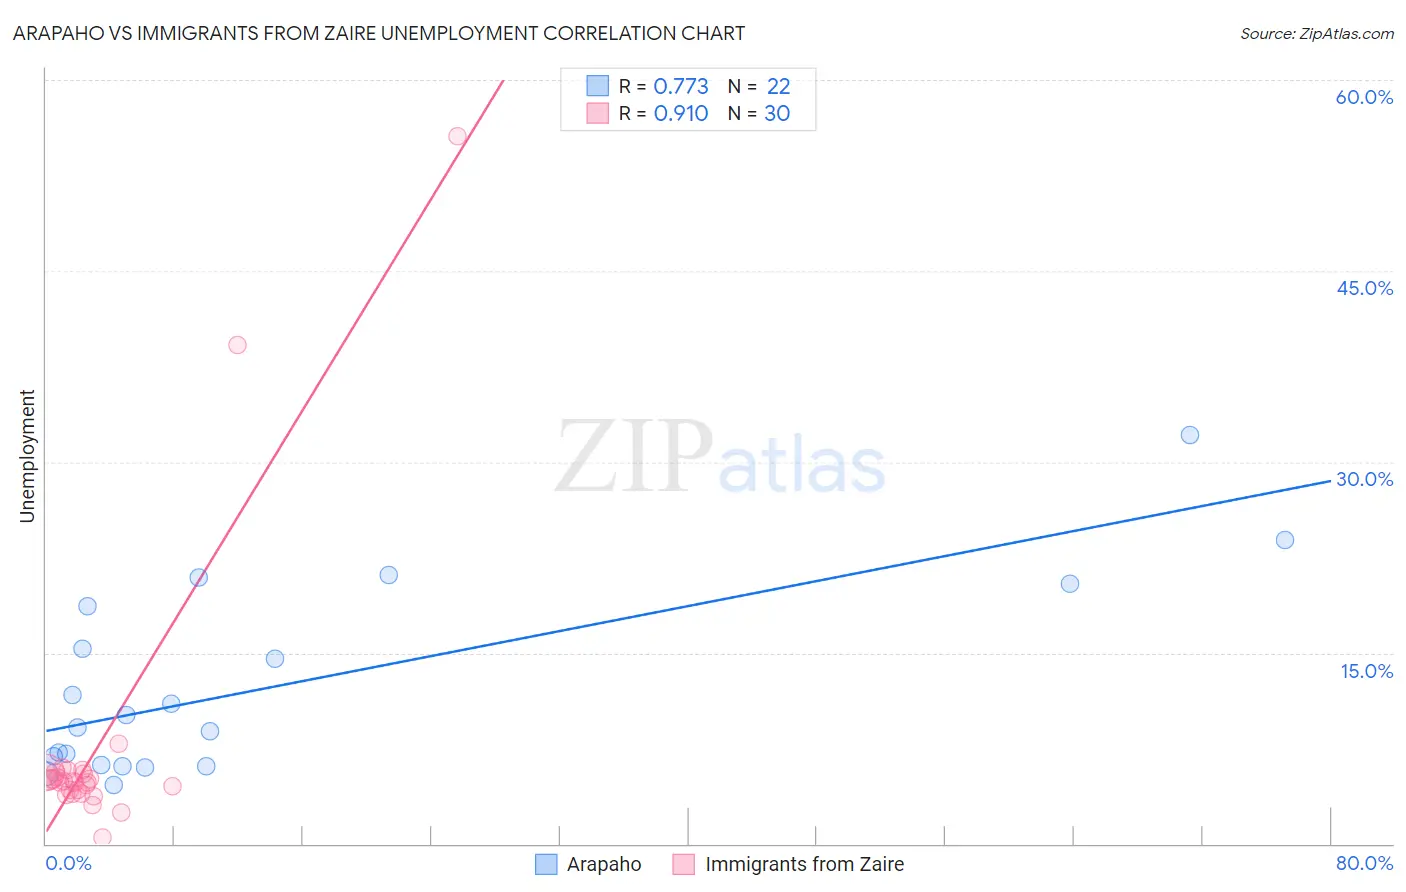
Arapaho vs Immigrants from Zaire Unemployment Correlation Chart
The statistical analysis conducted on geographies consisting of 29,773,692 people shows a strong positive correlation between the proportion of Arapaho and unemployment in the United States with a correlation coefficient (R) of 0.773 and weighted average of 9.8%. Similarly, the statistical analysis conducted on geographies consisting of 107,241,303 people shows a near-perfect positive correlation between the proportion of Immigrants from Zaire and unemployment in the United States with a correlation coefficient (R) of 0.910 and weighted average of 5.2%, a difference of 88.7%.
Unemployment Correlation Summary
| Measurement | Arapaho | Immigrants from Zaire |
| Minimum | 4.7% | 0.50% |
| Maximum | 32.1% | 55.6% |
| Range | 27.4% | 55.1% |
| Mean | 12.4% | 7.5% |
| Median | 9.7% | 4.9% |
| Interquartile 25% (IQ1) | 6.2% | 4.2% |
| Interquartile 75% (IQ3) | 18.7% | 5.6% |
| Interquartile Range (IQR) | 12.5% | 1.4% |
| Standard Deviation (Sample) | 7.5% | 11.1% |
| Standard Deviation (Population) | 7.3% | 10.9% |
Similar Demographics by Unemployment
Demographics Similar to Arapaho by Unemployment
In terms of unemployment, the demographic groups most similar to Arapaho are Inupiat (10.1%, a difference of 2.9%), Yuman (9.1%, a difference of 8.4%), Hopi (8.9%, a difference of 10.2%), Tohono O'odham (8.9%, a difference of 10.7%), and Crow (11.1%, a difference of 12.6%).
| Demographics | Rating | Rank | Unemployment |
| Immigrants | Dominican Republic | 0.0 /100 | #333 | Tragic 7.4% |
| Apache | 0.0 /100 | #334 | Tragic 7.4% |
| Alaskan Athabascans | 0.0 /100 | #335 | Tragic 7.7% |
| Immigrants | Yemen | 0.0 /100 | #336 | Tragic 7.7% |
| Cheyenne | 0.0 /100 | #337 | Tragic 8.0% |
| Pima | 0.0 /100 | #338 | Tragic 8.2% |
| Navajo | 0.0 /100 | #339 | Tragic 8.4% |
| Puerto Ricans | 0.0 /100 | #340 | Tragic 8.4% |
| Tohono O'odham | 0.0 /100 | #341 | Tragic 8.9% |
| Hopi | 0.0 /100 | #342 | Tragic 8.9% |
| Yuman | 0.0 /100 | #343 | Tragic 9.1% |
| Arapaho | 0.0 /100 | #344 | Tragic 9.8% |
| Inupiat | 0.0 /100 | #345 | Tragic 10.1% |
| Crow | 0.0 /100 | #346 | Tragic 11.1% |
| Yup'ik | 0.0 /100 | #347 | Tragic 13.6% |
Demographics Similar to Immigrants from Zaire by Unemployment
In terms of unemployment, the demographic groups most similar to Immigrants from Zaire are Immigrants from Colombia (5.2%, a difference of 0.0%), Spanish (5.2%, a difference of 0.020%), Immigrants from Oceania (5.2%, a difference of 0.030%), Laotian (5.2%, a difference of 0.11%), and Immigrants from Brazil (5.2%, a difference of 0.11%).
| Demographics | Rating | Rank | Unemployment |
| Immigrants | Kazakhstan | 70.4 /100 | #156 | Good 5.2% |
| Sri Lankans | 69.5 /100 | #157 | Good 5.2% |
| Immigrants | Egypt | 66.7 /100 | #158 | Good 5.2% |
| Immigrants | Russia | 66.6 /100 | #159 | Good 5.2% |
| Laotians | 66.3 /100 | #160 | Good 5.2% |
| Immigrants | Oceania | 65.2 /100 | #161 | Good 5.2% |
| Spanish | 65.1 /100 | #162 | Good 5.2% |
| Immigrants | Zaire | 64.7 /100 | #163 | Good 5.2% |
| Immigrants | Colombia | 64.7 /100 | #164 | Good 5.2% |
| Immigrants | Brazil | 63.1 /100 | #165 | Good 5.2% |
| Immigrants | Indonesia | 61.2 /100 | #166 | Good 5.2% |
| Colombians | 61.1 /100 | #167 | Good 5.2% |
| Uruguayans | 60.2 /100 | #168 | Good 5.2% |
| Immigrants | Morocco | 59.1 /100 | #169 | Average 5.2% |
| Immigrants | Nicaragua | 57.1 /100 | #170 | Average 5.2% |