Immigrants from Mexico vs Pueblo Unemployment
COMPARE
Immigrants from Mexico
Pueblo
Unemployment
Unemployment Comparison
Immigrants from Mexico
Pueblo
6.0%
UNEMPLOYMENT
0.0/ 100
METRIC RATING
279th/ 347
METRIC RANK
7.2%
UNEMPLOYMENT
0.0/ 100
METRIC RATING
327th/ 347
METRIC RANK
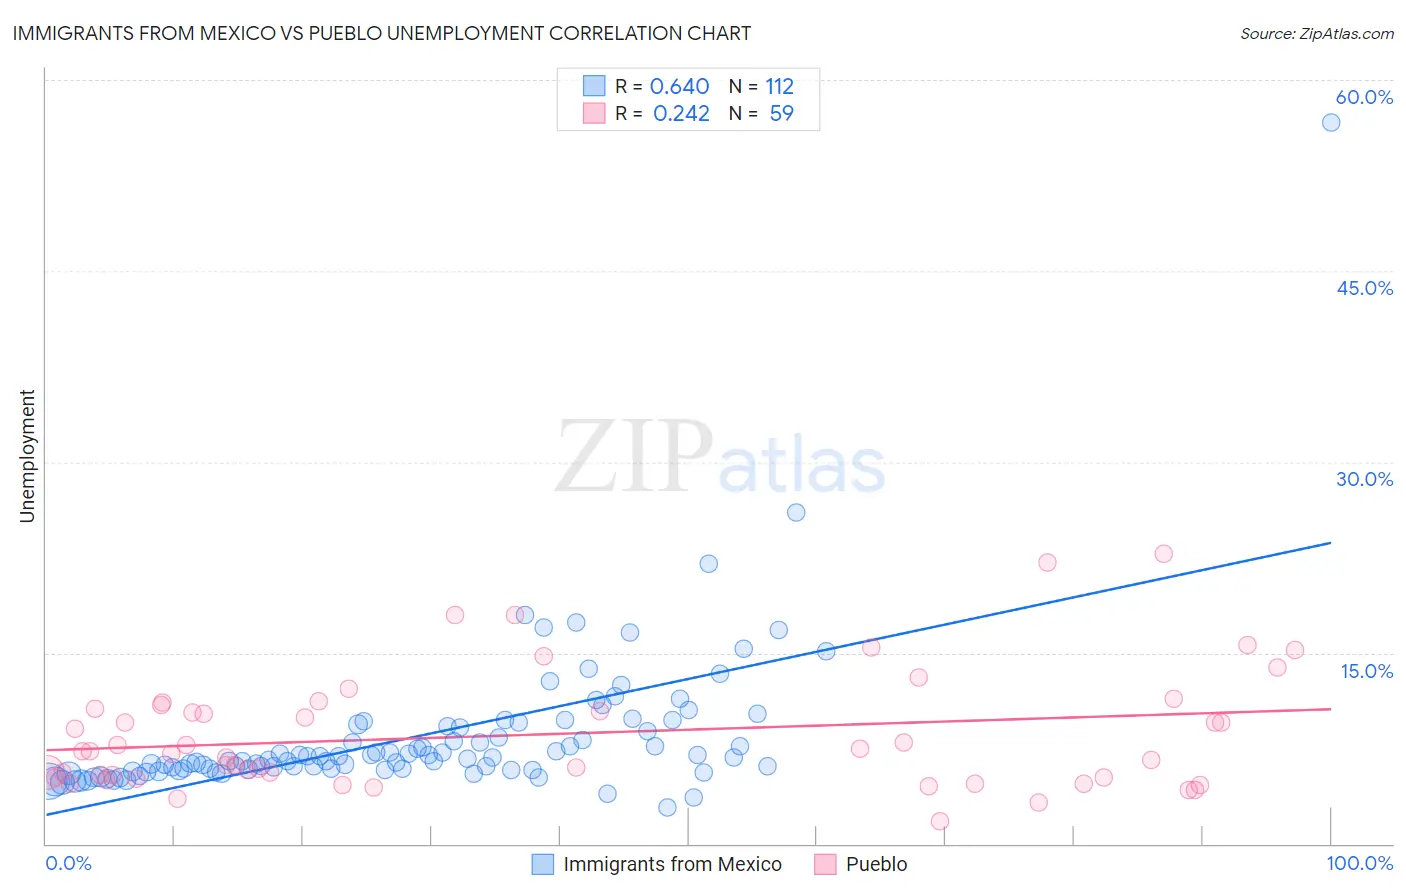
Immigrants from Mexico vs Pueblo Unemployment Correlation Chart
The statistical analysis conducted on geographies consisting of 511,903,872 people shows a significant positive correlation between the proportion of Immigrants from Mexico and unemployment in the United States with a correlation coefficient (R) of 0.640 and weighted average of 6.0%. Similarly, the statistical analysis conducted on geographies consisting of 120,042,060 people shows a weak positive correlation between the proportion of Pueblo and unemployment in the United States with a correlation coefficient (R) of 0.242 and weighted average of 7.2%, a difference of 18.8%.
Unemployment Correlation Summary
| Measurement | Immigrants from Mexico | Pueblo |
| Minimum | 2.8% | 1.8% |
| Maximum | 56.6% | 22.8% |
| Range | 53.8% | 21.0% |
| Mean | 8.4% | 8.6% |
| Median | 6.6% | 7.3% |
| Interquartile 25% (IQ1) | 5.8% | 5.2% |
| Interquartile 75% (IQ3) | 9.2% | 10.9% |
| Interquartile Range (IQR) | 3.4% | 5.7% |
| Standard Deviation (Sample) | 6.0% | 4.6% |
| Standard Deviation (Population) | 5.9% | 4.6% |
Similar Demographics by Unemployment
Demographics Similar to Immigrants from Mexico by Unemployment
In terms of unemployment, the demographic groups most similar to Immigrants from Mexico are Immigrants from Western Africa (6.0%, a difference of 0.0%), Ghanaian (6.0%, a difference of 0.43%), African (6.1%, a difference of 0.58%), Immigrants from the Azores (6.1%, a difference of 0.65%), and Armenian (6.0%, a difference of 0.72%).
| Demographics | Rating | Rank | Unemployment |
| Hispanics or Latinos | 0.0 /100 | #272 | Tragic 5.9% |
| Immigrants | Fiji | 0.0 /100 | #273 | Tragic 5.9% |
| Bahamians | 0.0 /100 | #274 | Tragic 5.9% |
| Immigrants | Latin America | 0.0 /100 | #275 | Tragic 5.9% |
| Immigrants | Central America | 0.0 /100 | #276 | Tragic 6.0% |
| Armenians | 0.0 /100 | #277 | Tragic 6.0% |
| Ghanaians | 0.0 /100 | #278 | Tragic 6.0% |
| Immigrants | Mexico | 0.0 /100 | #279 | Tragic 6.0% |
| Immigrants | Western Africa | 0.0 /100 | #280 | Tragic 6.0% |
| Africans | 0.0 /100 | #281 | Tragic 6.1% |
| Immigrants | Azores | 0.0 /100 | #282 | Tragic 6.1% |
| Immigrants | Ghana | 0.0 /100 | #283 | Tragic 6.1% |
| Aleuts | 0.0 /100 | #284 | Tragic 6.1% |
| Immigrants | Senegal | 0.0 /100 | #285 | Tragic 6.1% |
| Immigrants | Caribbean | 0.0 /100 | #286 | Tragic 6.2% |
Demographics Similar to Pueblo by Unemployment
In terms of unemployment, the demographic groups most similar to Pueblo are Paiute (7.1%, a difference of 0.53%), Tsimshian (7.2%, a difference of 0.91%), Alaska Native (7.2%, a difference of 1.2%), Native/Alaskan (7.0%, a difference of 1.7%), and Immigrants from Armenia (7.0%, a difference of 2.3%).
| Demographics | Rating | Rank | Unemployment |
| Immigrants | St. Vincent and the Grenadines | 0.0 /100 | #320 | Tragic 6.9% |
| Immigrants | Guyana | 0.0 /100 | #321 | Tragic 6.9% |
| Guyanese | 0.0 /100 | #322 | Tragic 6.9% |
| Immigrants | Grenada | 0.0 /100 | #323 | Tragic 6.9% |
| Immigrants | Armenia | 0.0 /100 | #324 | Tragic 7.0% |
| Natives/Alaskans | 0.0 /100 | #325 | Tragic 7.0% |
| Paiute | 0.0 /100 | #326 | Tragic 7.1% |
| Pueblo | 0.0 /100 | #327 | Tragic 7.2% |
| Tsimshian | 0.0 /100 | #328 | Tragic 7.2% |
| Alaska Natives | 0.0 /100 | #329 | Tragic 7.2% |
| Yakama | 0.0 /100 | #330 | Tragic 7.3% |
| Dominicans | 0.0 /100 | #331 | Tragic 7.4% |
| Sioux | 0.0 /100 | #332 | Tragic 7.4% |
| Immigrants | Dominican Republic | 0.0 /100 | #333 | Tragic 7.4% |
| Apache | 0.0 /100 | #334 | Tragic 7.4% |