Immigrants from Mexico vs Pueblo Disability Age 35 to 64
COMPARE
Immigrants from Mexico
Pueblo
Disability Age 35 to 64
Disability Age 35 to 64 Comparison
Immigrants from Mexico
Pueblo
12.1%
DISABILITY AGE 35 TO 64
2.2/ 100
METRIC RATING
245th/ 347
METRIC RANK
15.3%
DISABILITY AGE 35 TO 64
0.0/ 100
METRIC RATING
327th/ 347
METRIC RANK
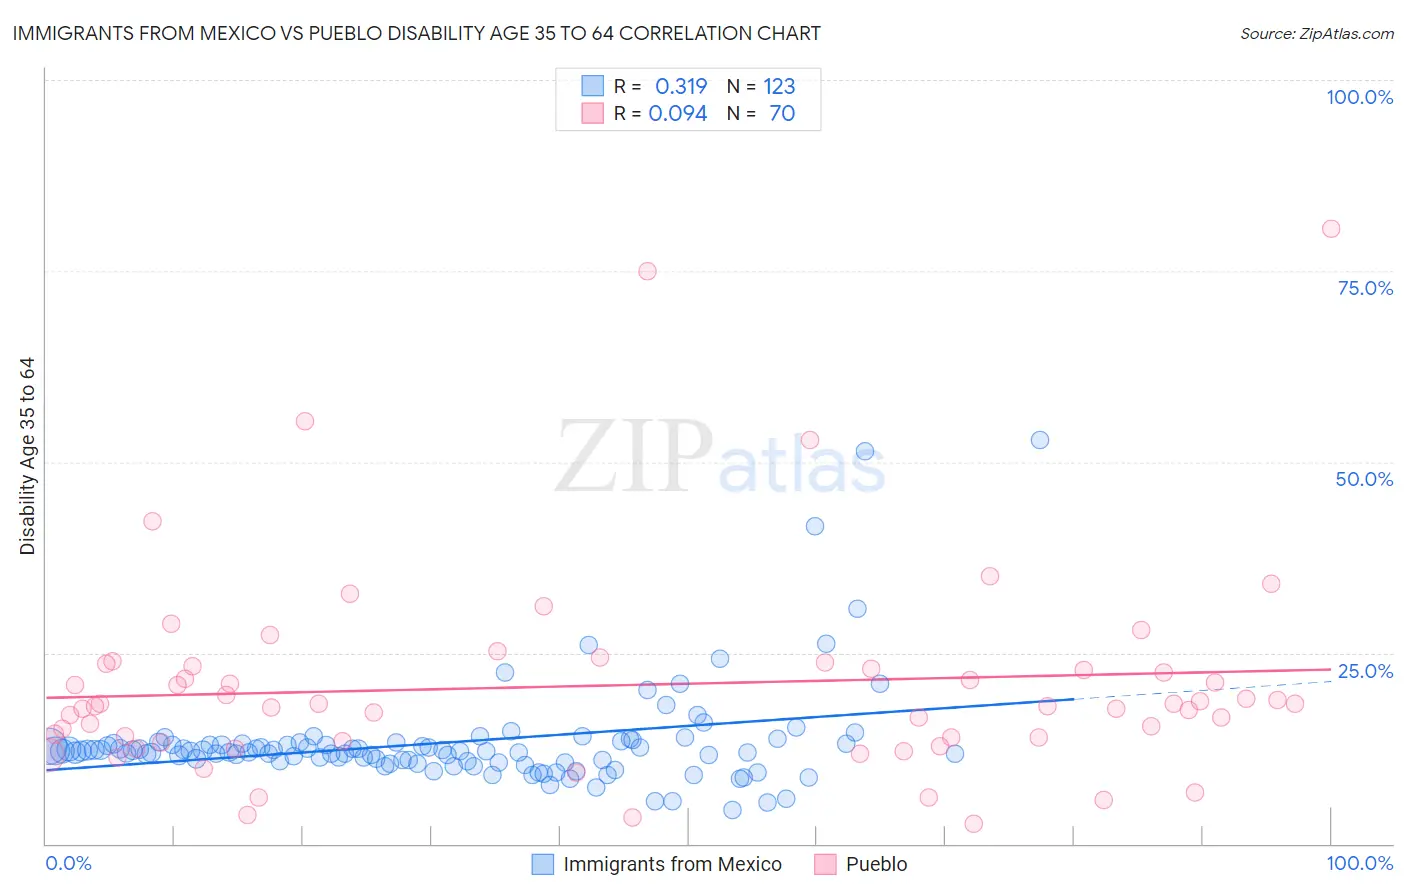
Immigrants from Mexico vs Pueblo Disability Age 35 to 64 Correlation Chart
The statistical analysis conducted on geographies consisting of 513,207,045 people shows a mild positive correlation between the proportion of Immigrants from Mexico and percentage of population with a disability between the ages 34 and 64 in the United States with a correlation coefficient (R) of 0.319 and weighted average of 12.1%. Similarly, the statistical analysis conducted on geographies consisting of 120,065,944 people shows a slight positive correlation between the proportion of Pueblo and percentage of population with a disability between the ages 34 and 64 in the United States with a correlation coefficient (R) of 0.094 and weighted average of 15.3%, a difference of 26.3%.
Disability Age 35 to 64 Correlation Summary
| Measurement | Immigrants from Mexico | Pueblo |
| Minimum | 4.4% | 2.7% |
| Maximum | 52.9% | 80.6% |
| Range | 48.5% | 77.9% |
| Mean | 13.3% | 20.7% |
| Median | 12.1% | 18.1% |
| Interquartile 25% (IQ1) | 10.8% | 13.5% |
| Interquartile 75% (IQ3) | 13.2% | 23.3% |
| Interquartile Range (IQR) | 2.3% | 9.8% |
| Standard Deviation (Sample) | 6.8% | 13.8% |
| Standard Deviation (Population) | 6.8% | 13.7% |
Similar Demographics by Disability Age 35 to 64
Demographics Similar to Immigrants from Mexico by Disability Age 35 to 64
In terms of disability age 35 to 64, the demographic groups most similar to Immigrants from Mexico are Finnish (12.1%, a difference of 0.10%), Slovak (12.1%, a difference of 0.36%), Samoan (12.1%, a difference of 0.46%), Mexican American Indian (12.0%, a difference of 0.73%), and Immigrants from Thailand (12.0%, a difference of 0.75%).
| Demographics | Rating | Rank | Disability Age 35 to 64 |
| West Indians | 3.7 /100 | #238 | Tragic 12.0% |
| Immigrants | Western Africa | 3.3 /100 | #239 | Tragic 12.0% |
| Immigrants | Thailand | 3.3 /100 | #240 | Tragic 12.0% |
| Mexican American Indians | 3.2 /100 | #241 | Tragic 12.0% |
| Samoans | 2.8 /100 | #242 | Tragic 12.1% |
| Slovaks | 2.7 /100 | #243 | Tragic 12.1% |
| Finns | 2.3 /100 | #244 | Tragic 12.1% |
| Immigrants | Mexico | 2.2 /100 | #245 | Tragic 12.1% |
| Guamanians/Chamorros | 1.4 /100 | #246 | Tragic 12.2% |
| Immigrants | Senegal | 1.3 /100 | #247 | Tragic 12.2% |
| Spaniards | 1.3 /100 | #248 | Tragic 12.3% |
| Hispanics or Latinos | 1.3 /100 | #249 | Tragic 12.3% |
| Immigrants | Burma/Myanmar | 1.2 /100 | #250 | Tragic 12.3% |
| Germans | 1.1 /100 | #251 | Tragic 12.3% |
| Irish | 1.0 /100 | #252 | Tragic 12.3% |
Demographics Similar to Pueblo by Disability Age 35 to 64
In terms of disability age 35 to 64, the demographic groups most similar to Pueblo are Native/Alaskan (15.3%, a difference of 0.020%), Cajun (15.3%, a difference of 0.18%), Cherokee (15.5%, a difference of 0.93%), Navajo (15.5%, a difference of 1.1%), and Arapaho (15.1%, a difference of 1.7%).
| Demographics | Rating | Rank | Disability Age 35 to 64 |
| Blacks/African Americans | 0.0 /100 | #320 | Tragic 14.7% |
| Comanche | 0.0 /100 | #321 | Tragic 14.7% |
| Potawatomi | 0.0 /100 | #322 | Tragic 14.8% |
| Apache | 0.0 /100 | #323 | Tragic 14.9% |
| Chippewa | 0.0 /100 | #324 | Tragic 15.0% |
| Arapaho | 0.0 /100 | #325 | Tragic 15.1% |
| Natives/Alaskans | 0.0 /100 | #326 | Tragic 15.3% |
| Pueblo | 0.0 /100 | #327 | Tragic 15.3% |
| Cajuns | 0.0 /100 | #328 | Tragic 15.3% |
| Cherokee | 0.0 /100 | #329 | Tragic 15.5% |
| Navajo | 0.0 /100 | #330 | Tragic 15.5% |
| Dutch West Indians | 0.0 /100 | #331 | Tragic 15.6% |
| Alaskan Athabascans | 0.0 /100 | #332 | Tragic 15.7% |
| Yuman | 0.0 /100 | #333 | Tragic 15.8% |
| Colville | 0.0 /100 | #334 | Tragic 15.8% |