Nonimmigrants vs Pueblo Unemployment
COMPARE
Nonimmigrants
Pueblo
Unemployment
Unemployment Comparison
Nonimmigrants
Pueblo
5.3%
UNEMPLOYMENT
47.9/ 100
METRIC RATING
177th/ 347
METRIC RANK
7.2%
UNEMPLOYMENT
0.0/ 100
METRIC RATING
327th/ 347
METRIC RANK
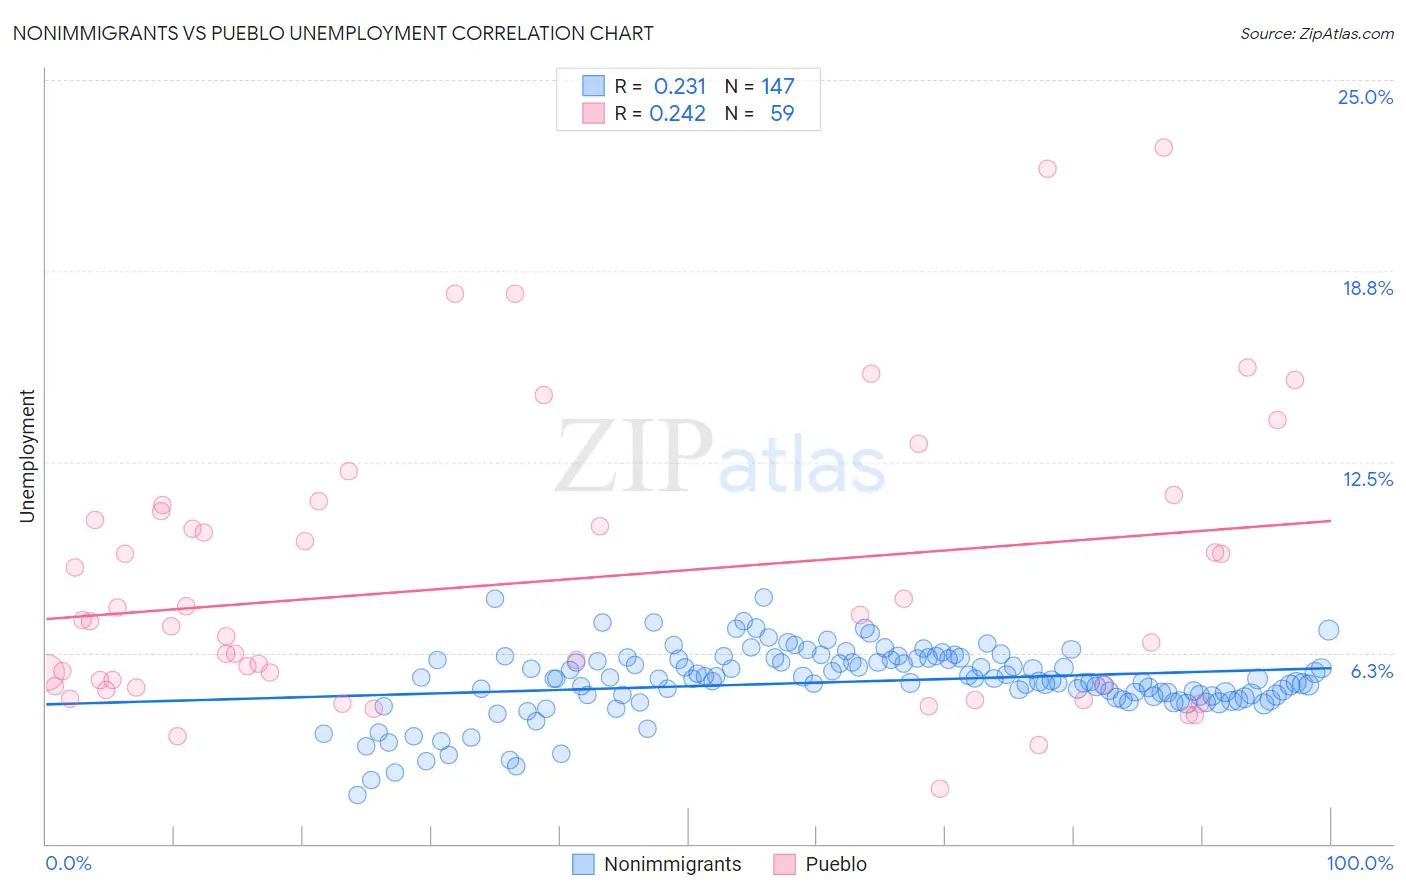
Nonimmigrants vs Pueblo Unemployment Correlation Chart
The statistical analysis conducted on geographies consisting of 578,965,270 people shows a weak positive correlation between the proportion of Nonimmigrants and unemployment in the United States with a correlation coefficient (R) of 0.231 and weighted average of 5.3%. Similarly, the statistical analysis conducted on geographies consisting of 120,042,060 people shows a weak positive correlation between the proportion of Pueblo and unemployment in the United States with a correlation coefficient (R) of 0.242 and weighted average of 7.2%, a difference of 35.9%.
Unemployment Correlation Summary
| Measurement | Nonimmigrants | Pueblo |
| Minimum | 1.6% | 1.8% |
| Maximum | 8.1% | 22.8% |
| Range | 6.5% | 21.0% |
| Mean | 5.3% | 8.6% |
| Median | 5.4% | 7.3% |
| Interquartile 25% (IQ1) | 4.8% | 5.2% |
| Interquartile 75% (IQ3) | 6.0% | 10.9% |
| Interquartile Range (IQR) | 1.2% | 5.7% |
| Standard Deviation (Sample) | 1.1% | 4.6% |
| Standard Deviation (Population) | 1.1% | 4.6% |
Similar Demographics by Unemployment
Demographics Similar to Nonimmigrants by Unemployment
In terms of unemployment, the demographic groups most similar to Nonimmigrants are Afghan (5.3%, a difference of 0.030%), Nicaraguan (5.3%, a difference of 0.050%), Malaysian (5.3%, a difference of 0.060%), Taiwanese (5.3%, a difference of 0.11%), and Immigrants from Congo (5.3%, a difference of 0.13%).
| Demographics | Rating | Rank | Unemployment |
| Immigrants | Nicaragua | 57.1 /100 | #170 | Average 5.2% |
| Puget Sound Salish | 56.6 /100 | #171 | Average 5.2% |
| Immigrants | Vietnam | 52.5 /100 | #172 | Average 5.2% |
| Immigrants | Poland | 51.8 /100 | #173 | Average 5.3% |
| Immigrants | Congo | 50.0 /100 | #174 | Average 5.3% |
| Taiwanese | 49.6 /100 | #175 | Average 5.3% |
| Nicaraguans | 48.7 /100 | #176 | Average 5.3% |
| Immigrants | Nonimmigrants | 47.9 /100 | #177 | Average 5.3% |
| Afghans | 47.4 /100 | #178 | Average 5.3% |
| Malaysians | 46.8 /100 | #179 | Average 5.3% |
| Immigrants | Greece | 45.0 /100 | #180 | Average 5.3% |
| Albanians | 43.5 /100 | #181 | Average 5.3% |
| Spaniards | 42.2 /100 | #182 | Average 5.3% |
| Brazilians | 40.2 /100 | #183 | Average 5.3% |
| Assyrians/Chaldeans/Syriacs | 39.2 /100 | #184 | Fair 5.3% |
Demographics Similar to Pueblo by Unemployment
In terms of unemployment, the demographic groups most similar to Pueblo are Paiute (7.1%, a difference of 0.53%), Tsimshian (7.2%, a difference of 0.91%), Alaska Native (7.2%, a difference of 1.2%), Native/Alaskan (7.0%, a difference of 1.7%), and Immigrants from Armenia (7.0%, a difference of 2.3%).
| Demographics | Rating | Rank | Unemployment |
| Immigrants | St. Vincent and the Grenadines | 0.0 /100 | #320 | Tragic 6.9% |
| Immigrants | Guyana | 0.0 /100 | #321 | Tragic 6.9% |
| Guyanese | 0.0 /100 | #322 | Tragic 6.9% |
| Immigrants | Grenada | 0.0 /100 | #323 | Tragic 6.9% |
| Immigrants | Armenia | 0.0 /100 | #324 | Tragic 7.0% |
| Natives/Alaskans | 0.0 /100 | #325 | Tragic 7.0% |
| Paiute | 0.0 /100 | #326 | Tragic 7.1% |
| Pueblo | 0.0 /100 | #327 | Tragic 7.2% |
| Tsimshian | 0.0 /100 | #328 | Tragic 7.2% |
| Alaska Natives | 0.0 /100 | #329 | Tragic 7.2% |
| Yakama | 0.0 /100 | #330 | Tragic 7.3% |
| Dominicans | 0.0 /100 | #331 | Tragic 7.4% |
| Sioux | 0.0 /100 | #332 | Tragic 7.4% |
| Immigrants | Dominican Republic | 0.0 /100 | #333 | Tragic 7.4% |
| Apache | 0.0 /100 | #334 | Tragic 7.4% |