Immigrants from Mexico vs Central American Indian Unemployment
COMPARE
Immigrants from Mexico
Central American Indian
Unemployment
Unemployment Comparison
Immigrants from Mexico
Central American Indians
6.0%
UNEMPLOYMENT
0.0/ 100
METRIC RATING
279th/ 347
METRIC RANK
6.2%
UNEMPLOYMENT
0.0/ 100
METRIC RATING
292nd/ 347
METRIC RANK
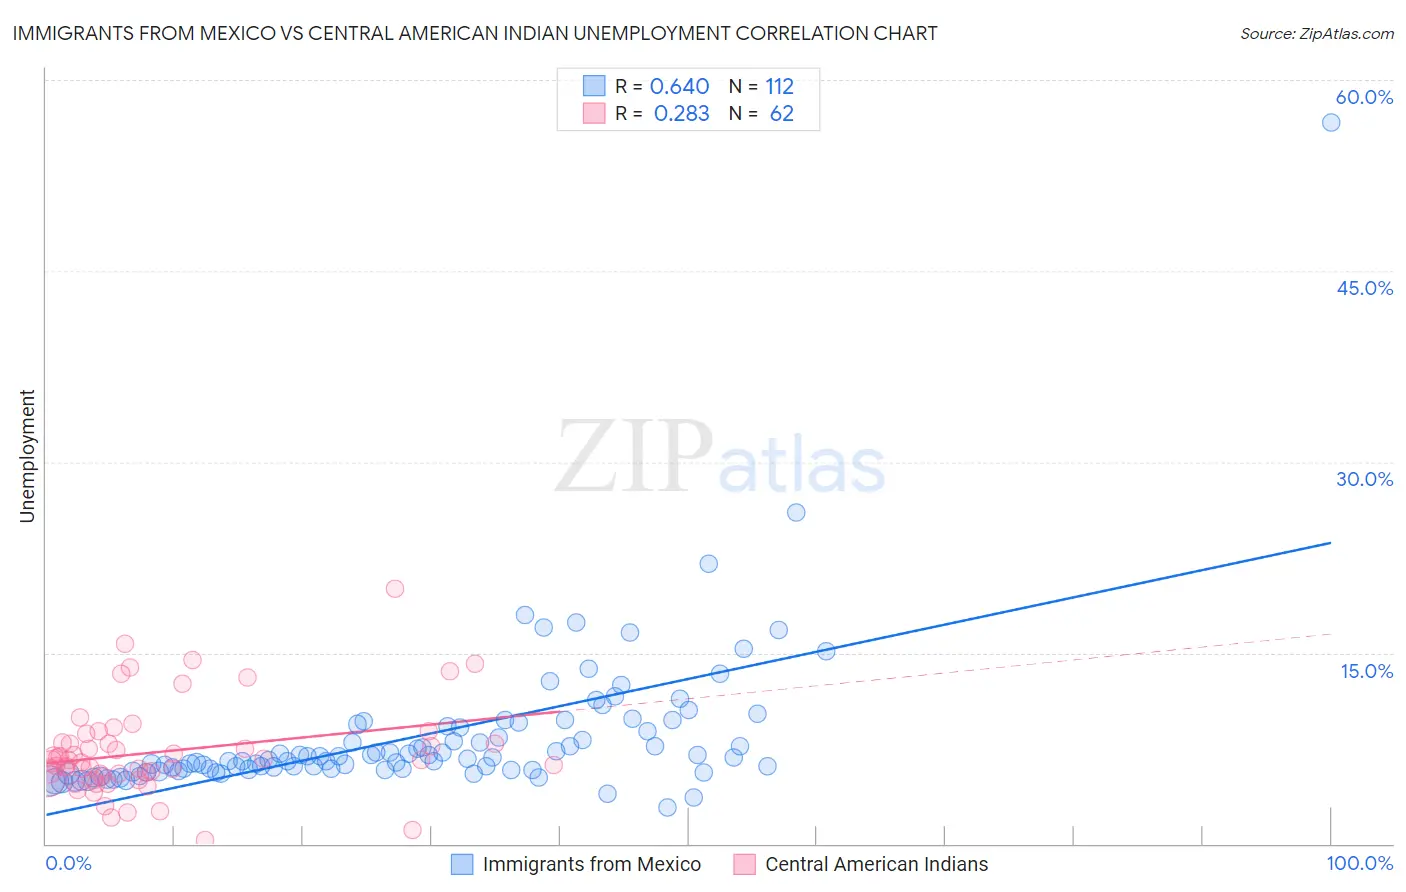
Immigrants from Mexico vs Central American Indian Unemployment Correlation Chart
The statistical analysis conducted on geographies consisting of 511,903,872 people shows a significant positive correlation between the proportion of Immigrants from Mexico and unemployment in the United States with a correlation coefficient (R) of 0.640 and weighted average of 6.0%. Similarly, the statistical analysis conducted on geographies consisting of 325,961,025 people shows a weak positive correlation between the proportion of Central American Indians and unemployment in the United States with a correlation coefficient (R) of 0.283 and weighted average of 6.2%, a difference of 3.6%.
Unemployment Correlation Summary
| Measurement | Immigrants from Mexico | Central American Indian |
| Minimum | 2.8% | 0.30% |
| Maximum | 56.6% | 20.0% |
| Range | 53.8% | 19.7% |
| Mean | 8.4% | 7.2% |
| Median | 6.6% | 6.5% |
| Interquartile 25% (IQ1) | 5.8% | 5.3% |
| Interquartile 75% (IQ3) | 9.2% | 7.9% |
| Interquartile Range (IQR) | 3.4% | 2.6% |
| Standard Deviation (Sample) | 6.0% | 3.6% |
| Standard Deviation (Population) | 5.9% | 3.6% |
Demographics Similar to Immigrants from Mexico and Central American Indians by Unemployment
In terms of unemployment, the demographic groups most similar to Immigrants from Mexico are Immigrants from Western Africa (6.0%, a difference of 0.0%), Ghanaian (6.0%, a difference of 0.43%), African (6.1%, a difference of 0.58%), Immigrants from the Azores (6.1%, a difference of 0.65%), and Armenian (6.0%, a difference of 0.72%). Similarly, the demographic groups most similar to Central American Indians are Haitian (6.2%, a difference of 0.020%), Immigrants from Ecuador (6.2%, a difference of 0.090%), Spanish American Indian (6.2%, a difference of 0.090%), U.S. Virgin Islander (6.3%, a difference of 0.22%), and Senegalese (6.2%, a difference of 0.54%).
| Demographics | Rating | Rank | Unemployment |
| Immigrants | Latin America | 0.0 /100 | #275 | Tragic 5.9% |
| Immigrants | Central America | 0.0 /100 | #276 | Tragic 6.0% |
| Armenians | 0.0 /100 | #277 | Tragic 6.0% |
| Ghanaians | 0.0 /100 | #278 | Tragic 6.0% |
| Immigrants | Mexico | 0.0 /100 | #279 | Tragic 6.0% |
| Immigrants | Western Africa | 0.0 /100 | #280 | Tragic 6.0% |
| Africans | 0.0 /100 | #281 | Tragic 6.1% |
| Immigrants | Azores | 0.0 /100 | #282 | Tragic 6.1% |
| Immigrants | Ghana | 0.0 /100 | #283 | Tragic 6.1% |
| Aleuts | 0.0 /100 | #284 | Tragic 6.1% |
| Immigrants | Senegal | 0.0 /100 | #285 | Tragic 6.1% |
| Immigrants | Caribbean | 0.0 /100 | #286 | Tragic 6.2% |
| Nepalese | 0.0 /100 | #287 | Tragic 6.2% |
| Ecuadorians | 0.0 /100 | #288 | Tragic 6.2% |
| Chippewa | 0.0 /100 | #289 | Tragic 6.2% |
| Senegalese | 0.0 /100 | #290 | Tragic 6.2% |
| Haitians | 0.0 /100 | #291 | Tragic 6.2% |
| Central American Indians | 0.0 /100 | #292 | Tragic 6.2% |
| Immigrants | Ecuador | 0.0 /100 | #293 | Tragic 6.2% |
| Spanish American Indians | 0.0 /100 | #294 | Tragic 6.2% |
| U.S. Virgin Islanders | 0.0 /100 | #295 | Tragic 6.3% |