Immigrants from Mexico vs Panamanian Unemployment
COMPARE
Immigrants from Mexico
Panamanian
Unemployment
Unemployment Comparison
Immigrants from Mexico
Panamanians
6.0%
UNEMPLOYMENT
0.0/ 100
METRIC RATING
279th/ 347
METRIC RANK
5.5%
UNEMPLOYMENT
4.7/ 100
METRIC RATING
234th/ 347
METRIC RANK
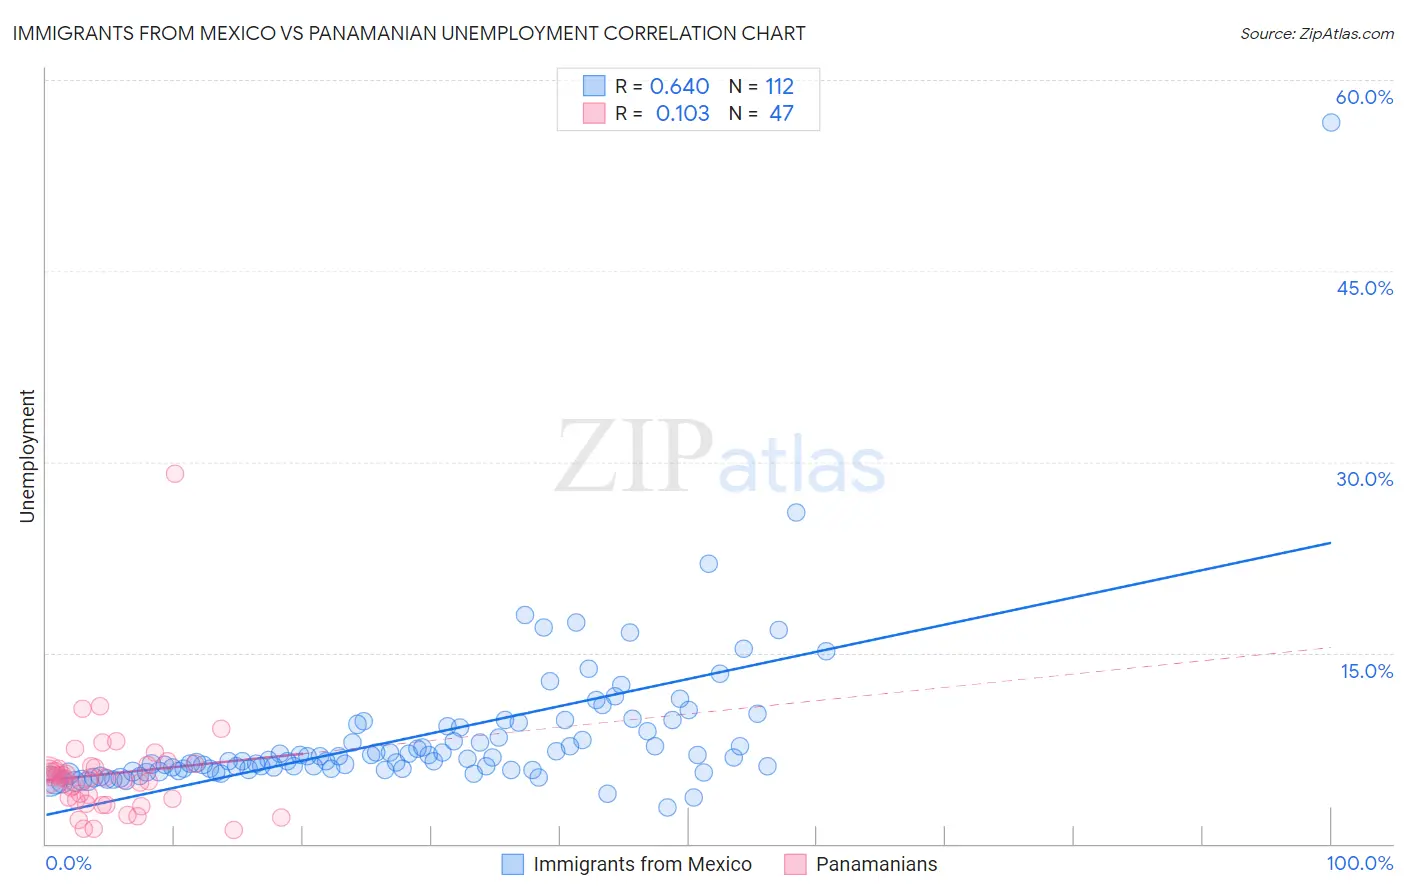
Immigrants from Mexico vs Panamanian Unemployment Correlation Chart
The statistical analysis conducted on geographies consisting of 511,903,872 people shows a significant positive correlation between the proportion of Immigrants from Mexico and unemployment in the United States with a correlation coefficient (R) of 0.640 and weighted average of 6.0%. Similarly, the statistical analysis conducted on geographies consisting of 281,131,526 people shows a poor positive correlation between the proportion of Panamanians and unemployment in the United States with a correlation coefficient (R) of 0.103 and weighted average of 5.5%, a difference of 9.4%.
Unemployment Correlation Summary
| Measurement | Immigrants from Mexico | Panamanian |
| Minimum | 2.8% | 1.1% |
| Maximum | 56.6% | 29.1% |
| Range | 53.8% | 28.0% |
| Mean | 8.4% | 5.5% |
| Median | 6.6% | 5.2% |
| Interquartile 25% (IQ1) | 5.8% | 3.5% |
| Interquartile 75% (IQ3) | 9.2% | 6.1% |
| Interquartile Range (IQR) | 3.4% | 2.6% |
| Standard Deviation (Sample) | 6.0% | 4.2% |
| Standard Deviation (Population) | 5.9% | 4.1% |
Similar Demographics by Unemployment
Demographics Similar to Immigrants from Mexico by Unemployment
In terms of unemployment, the demographic groups most similar to Immigrants from Mexico are Immigrants from Western Africa (6.0%, a difference of 0.0%), Ghanaian (6.0%, a difference of 0.43%), African (6.1%, a difference of 0.58%), Immigrants from the Azores (6.1%, a difference of 0.65%), and Armenian (6.0%, a difference of 0.72%).
| Demographics | Rating | Rank | Unemployment |
| Hispanics or Latinos | 0.0 /100 | #272 | Tragic 5.9% |
| Immigrants | Fiji | 0.0 /100 | #273 | Tragic 5.9% |
| Bahamians | 0.0 /100 | #274 | Tragic 5.9% |
| Immigrants | Latin America | 0.0 /100 | #275 | Tragic 5.9% |
| Immigrants | Central America | 0.0 /100 | #276 | Tragic 6.0% |
| Armenians | 0.0 /100 | #277 | Tragic 6.0% |
| Ghanaians | 0.0 /100 | #278 | Tragic 6.0% |
| Immigrants | Mexico | 0.0 /100 | #279 | Tragic 6.0% |
| Immigrants | Western Africa | 0.0 /100 | #280 | Tragic 6.0% |
| Africans | 0.0 /100 | #281 | Tragic 6.1% |
| Immigrants | Azores | 0.0 /100 | #282 | Tragic 6.1% |
| Immigrants | Ghana | 0.0 /100 | #283 | Tragic 6.1% |
| Aleuts | 0.0 /100 | #284 | Tragic 6.1% |
| Immigrants | Senegal | 0.0 /100 | #285 | Tragic 6.1% |
| Immigrants | Caribbean | 0.0 /100 | #286 | Tragic 6.2% |
Demographics Similar to Panamanians by Unemployment
In terms of unemployment, the demographic groups most similar to Panamanians are Immigrants from Syria (5.5%, a difference of 0.030%), Immigrants from Africa (5.5%, a difference of 0.080%), Comanche (5.5%, a difference of 0.080%), Hawaiian (5.5%, a difference of 0.21%), and Ottawa (5.5%, a difference of 0.21%).
| Demographics | Rating | Rank | Unemployment |
| Immigrants | Lebanon | 7.0 /100 | #227 | Tragic 5.5% |
| Guamanians/Chamorros | 6.3 /100 | #228 | Tragic 5.5% |
| Hawaiians | 5.4 /100 | #229 | Tragic 5.5% |
| Ottawa | 5.4 /100 | #230 | Tragic 5.5% |
| Immigrants | Africa | 4.9 /100 | #231 | Tragic 5.5% |
| Comanche | 4.9 /100 | #232 | Tragic 5.5% |
| Immigrants | Syria | 4.8 /100 | #233 | Tragic 5.5% |
| Panamanians | 4.7 /100 | #234 | Tragic 5.5% |
| Immigrants | Panama | 3.4 /100 | #235 | Tragic 5.5% |
| Immigrants | Cambodia | 3.3 /100 | #236 | Tragic 5.5% |
| Moroccans | 3.2 /100 | #237 | Tragic 5.5% |
| Immigrants | Western Asia | 2.8 /100 | #238 | Tragic 5.5% |
| Immigrants | Immigrants | 2.6 /100 | #239 | Tragic 5.5% |
| Cree | 2.6 /100 | #240 | Tragic 5.6% |
| Tlingit-Haida | 2.0 /100 | #241 | Tragic 5.6% |