Macedonian vs Immigrants from Bangladesh Unemployment Among Women with Children Under 18 years
COMPARE
Macedonian
Immigrants from Bangladesh
Unemployment Among Women with Children Under 18 years
Unemployment Among Women with Children Under 18 years Comparison
Macedonians
Immigrants from Bangladesh
5.3%
UNEMPLOYMENT AMONG WOMEN WITH CHILDREN UNDER 18 YEARS
87.7/ 100
METRIC RATING
116th/ 347
METRIC RANK
6.4%
UNEMPLOYMENT AMONG WOMEN WITH CHILDREN UNDER 18 YEARS
0.0/ 100
METRIC RATING
293rd/ 347
METRIC RANK
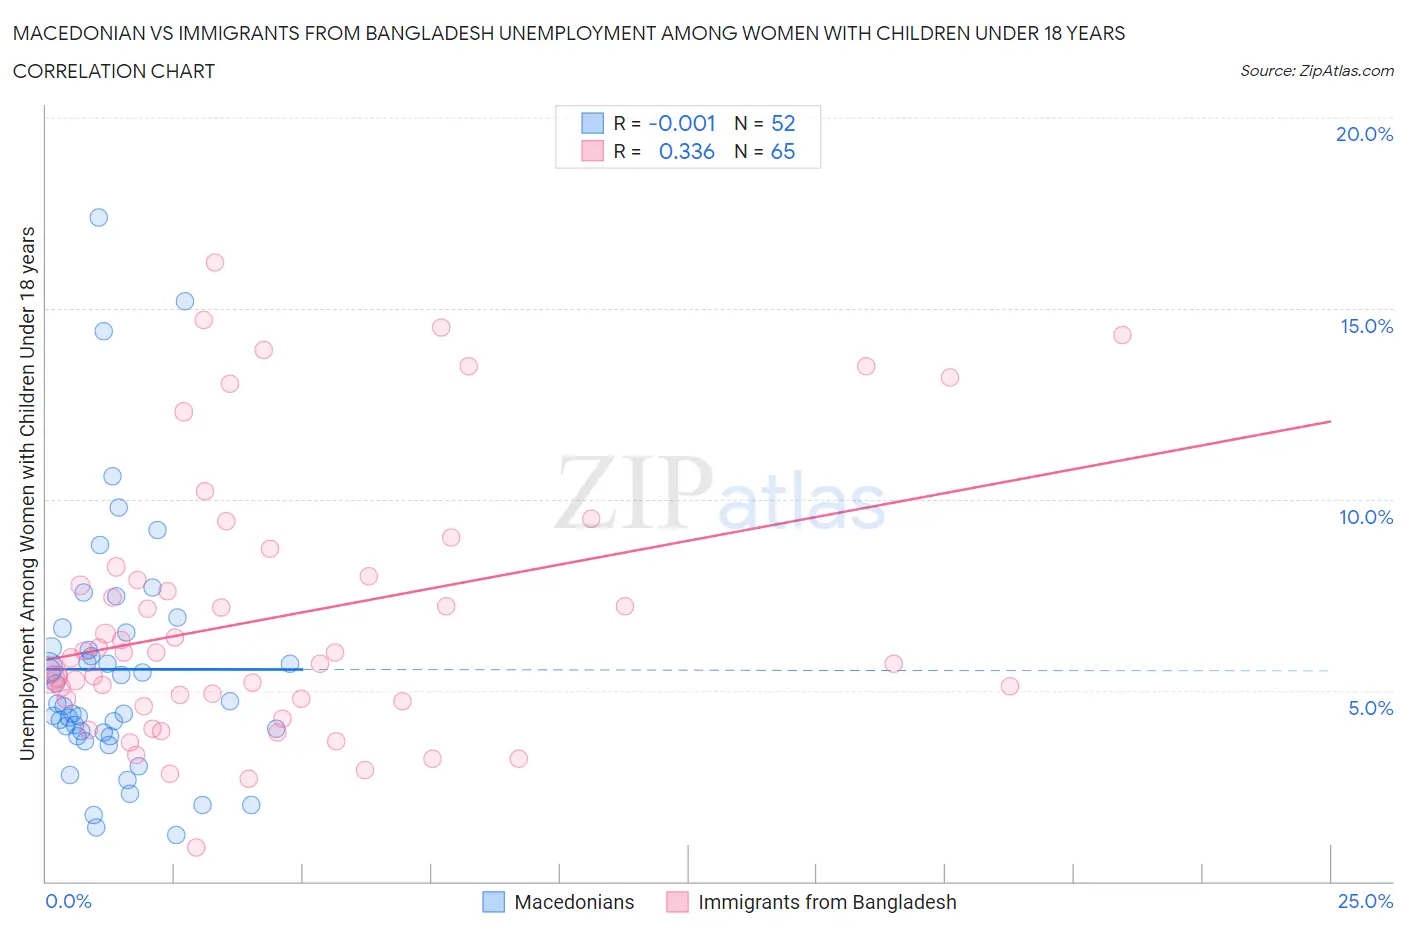
Macedonian vs Immigrants from Bangladesh Unemployment Among Women with Children Under 18 years Correlation Chart
The statistical analysis conducted on geographies consisting of 130,061,187 people shows no correlation between the proportion of Macedonians and unemployment rate among women with children under the age of 18 in the United States with a correlation coefficient (R) of -0.001 and weighted average of 5.3%. Similarly, the statistical analysis conducted on geographies consisting of 201,017,496 people shows a mild positive correlation between the proportion of Immigrants from Bangladesh and unemployment rate among women with children under the age of 18 in the United States with a correlation coefficient (R) of 0.336 and weighted average of 6.4%, a difference of 21.4%.
Unemployment Among Women with Children Under 18 years Correlation Summary
| Measurement | Macedonian | Immigrants from Bangladesh |
| Minimum | 1.2% | 0.90% |
| Maximum | 17.4% | 16.2% |
| Range | 16.2% | 15.3% |
| Mean | 5.5% | 6.9% |
| Median | 4.6% | 6.0% |
| Interquartile 25% (IQ1) | 3.9% | 4.7% |
| Interquartile 75% (IQ3) | 6.3% | 8.1% |
| Interquartile Range (IQR) | 2.4% | 3.4% |
| Standard Deviation (Sample) | 3.3% | 3.5% |
| Standard Deviation (Population) | 3.2% | 3.5% |
Similar Demographics by Unemployment Among Women with Children Under 18 years
Demographics Similar to Macedonians by Unemployment Among Women with Children Under 18 years
In terms of unemployment among women with children under 18 years, the demographic groups most similar to Macedonians are Canadian (5.3%, a difference of 0.060%), Hungarian (5.3%, a difference of 0.070%), Kenyan (5.3%, a difference of 0.080%), French (5.2%, a difference of 0.12%), and Immigrants from Eastern Europe (5.2%, a difference of 0.14%).
| Demographics | Rating | Rank | Unemployment Among Women with Children Under 18 years |
| Immigrants | Russia | 89.0 /100 | #109 | Excellent 5.2% |
| Immigrants | Czechoslovakia | 88.9 /100 | #110 | Excellent 5.2% |
| French Canadians | 88.9 /100 | #111 | Excellent 5.2% |
| Immigrants | Eastern Europe | 88.5 /100 | #112 | Excellent 5.2% |
| French | 88.4 /100 | #113 | Excellent 5.2% |
| Kenyans | 88.2 /100 | #114 | Excellent 5.3% |
| Hungarians | 88.1 /100 | #115 | Excellent 5.3% |
| Macedonians | 87.7 /100 | #116 | Excellent 5.3% |
| Canadians | 87.4 /100 | #117 | Excellent 5.3% |
| Immigrants | Europe | 86.7 /100 | #118 | Excellent 5.3% |
| Basques | 86.5 /100 | #119 | Excellent 5.3% |
| Egyptians | 86.4 /100 | #120 | Excellent 5.3% |
| Immigrants | Romania | 85.8 /100 | #121 | Excellent 5.3% |
| Scotch-Irish | 85.7 /100 | #122 | Excellent 5.3% |
| Sudanese | 84.3 /100 | #123 | Excellent 5.3% |
Demographics Similar to Immigrants from Bangladesh by Unemployment Among Women with Children Under 18 years
In terms of unemployment among women with children under 18 years, the demographic groups most similar to Immigrants from Bangladesh are Mexican (6.4%, a difference of 0.030%), Honduran (6.4%, a difference of 0.030%), Immigrants from Guatemala (6.4%, a difference of 0.090%), Barbadian (6.4%, a difference of 0.11%), and Haitian (6.4%, a difference of 0.13%).
| Demographics | Rating | Rank | Unemployment Among Women with Children Under 18 years |
| Alaskan Athabascans | 0.0 /100 | #286 | Tragic 6.3% |
| Kiowa | 0.0 /100 | #287 | Tragic 6.3% |
| Cree | 0.0 /100 | #288 | Tragic 6.3% |
| Immigrants | Caribbean | 0.0 /100 | #289 | Tragic 6.4% |
| Blackfeet | 0.0 /100 | #290 | Tragic 6.4% |
| Immigrants | Guatemala | 0.0 /100 | #291 | Tragic 6.4% |
| Mexicans | 0.0 /100 | #292 | Tragic 6.4% |
| Immigrants | Bangladesh | 0.0 /100 | #293 | Tragic 6.4% |
| Hondurans | 0.0 /100 | #294 | Tragic 6.4% |
| Barbadians | 0.0 /100 | #295 | Tragic 6.4% |
| Haitians | 0.0 /100 | #296 | Tragic 6.4% |
| Immigrants | Senegal | 0.0 /100 | #297 | Tragic 6.4% |
| Immigrants | Latin America | 0.0 /100 | #298 | Tragic 6.4% |
| Jamaicans | 0.0 /100 | #299 | Tragic 6.4% |
| Immigrants | Jamaica | 0.0 /100 | #300 | Tragic 6.4% |